ES监控链路搭建 Elasticsearch_exporter + Prometheus + Grafana
原创ES监控链路搭建 Elasticsearch_exporter + Prometheus + Grafana
原创
沈小翊
发布于 2023-11-24 11:19:24
发布于 2023-11-24 11:19:24
文章被收录于专栏:大数据生态
Elasticsearch_exporter 下载地址:Elasticsearch_exporter 下载地址
grafana下载地址:grafana下载地址
Prometheus下载地址:Prometheus下载地址
Elasticsearch_exporter安装
#ES集群需要关闭登录认证
tar -zxvf elasticsearch_exporter-1.6.0.linux-386.tar.gz
cd elasticsearch_exporter-1.6.0.linux-386
./elasticsearch_exporter --es.all --es.indices --es.indices_settings --es.shards --es.ssl-skip-verify --es.uri http://127.0.0.1:9200
Prometheus安装
tar -zxvf prometheus-2.47.0.linux-386.tar.gz
cd prometheus-2.47.0.linux-386
vim prometheus.yml
#最下方添加
  - job_name: elasticsearch
    metrics_path: "/metrics"
    static_configs:
    - targets: ['127.0.0.1:9114']
      labels:
        instance: elasticsearch
        group: inner

./prometheus --config.file=prometheus.yml

#查看是否启动成功
ss -lnput | grep 9090
Grafana安装
yum install -y grafana-7.1.4-1.x86_64.rpm
systemctl enable grafana-server && systemctl start grafana-server
grafana没有索引维度数据是因为开启Elasticsearch_exporter采集时没有带上相应参数
./elasticsearch_exporter --es.all --es.indices --es.indices_settings --es.shardsgrafana访问地址: http://ip:3000
默认用户名: admin
默认密码: admin
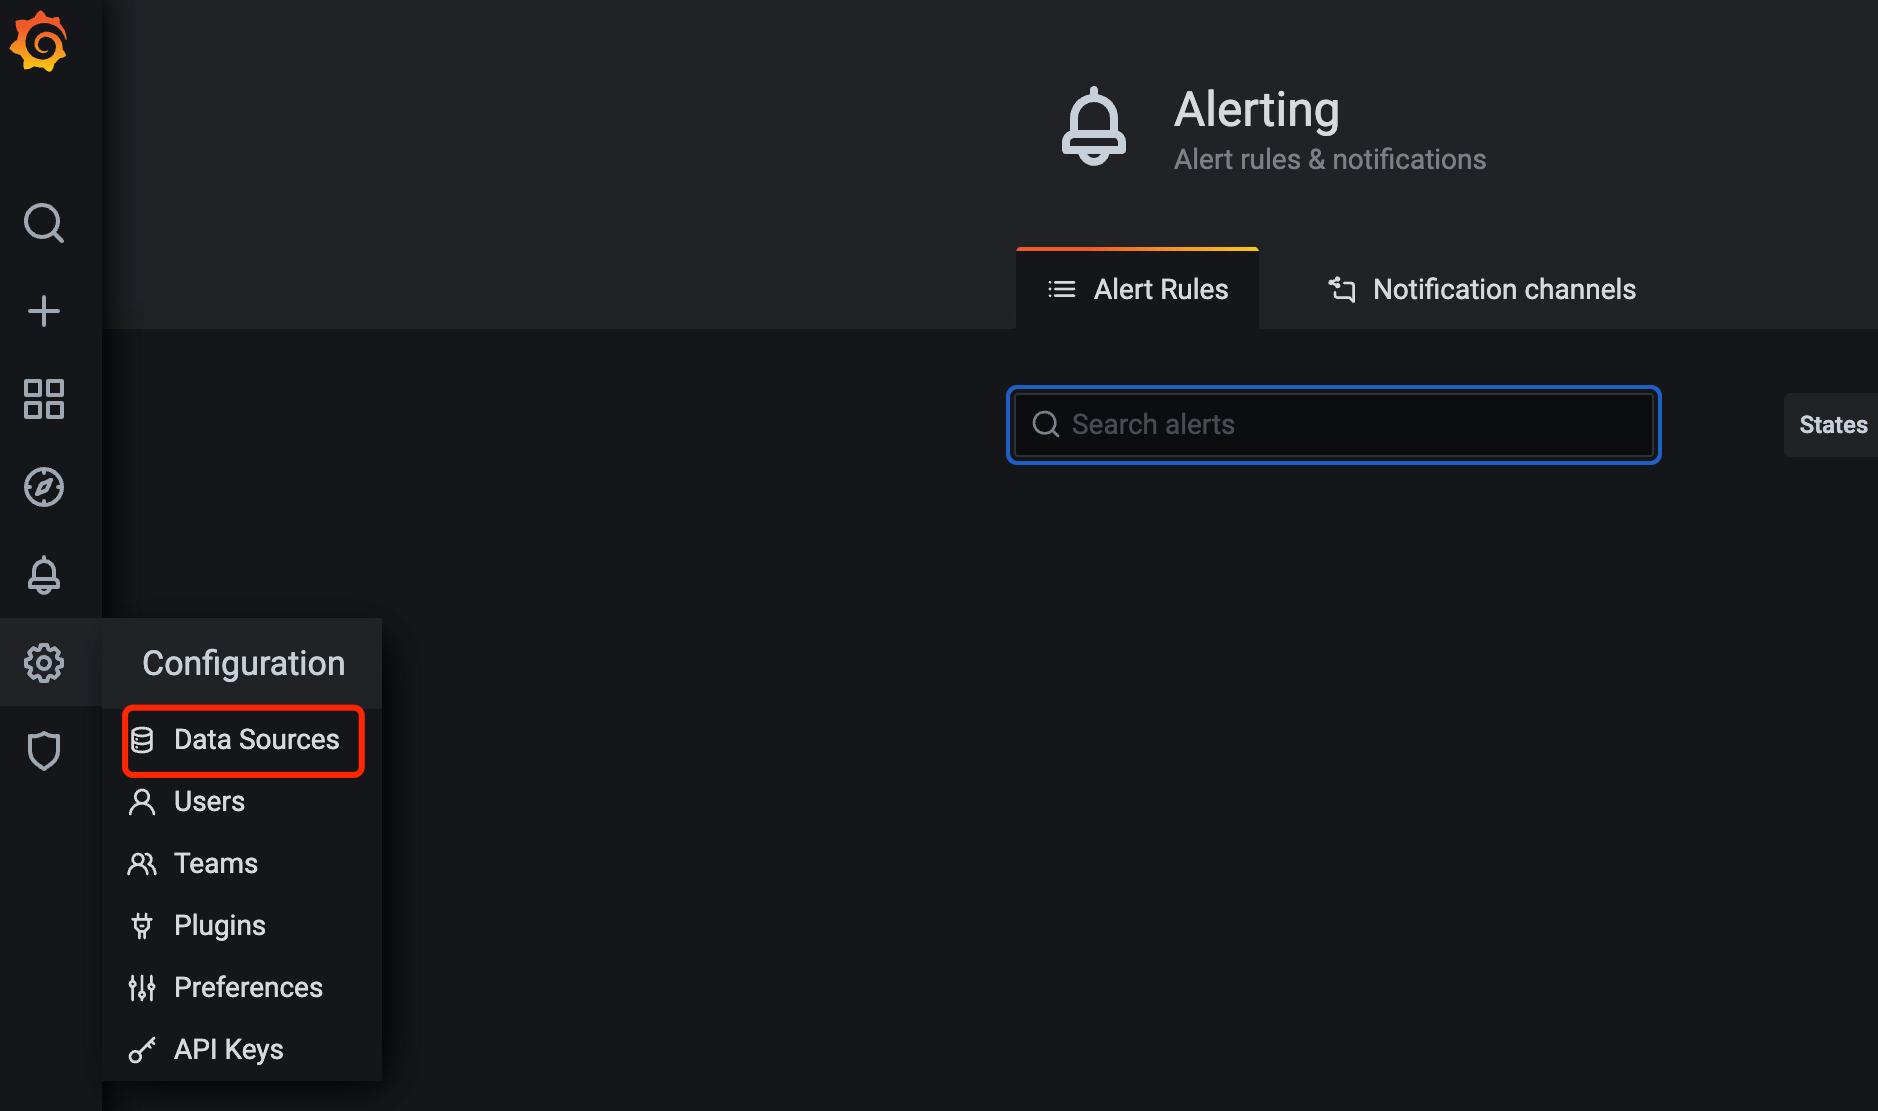
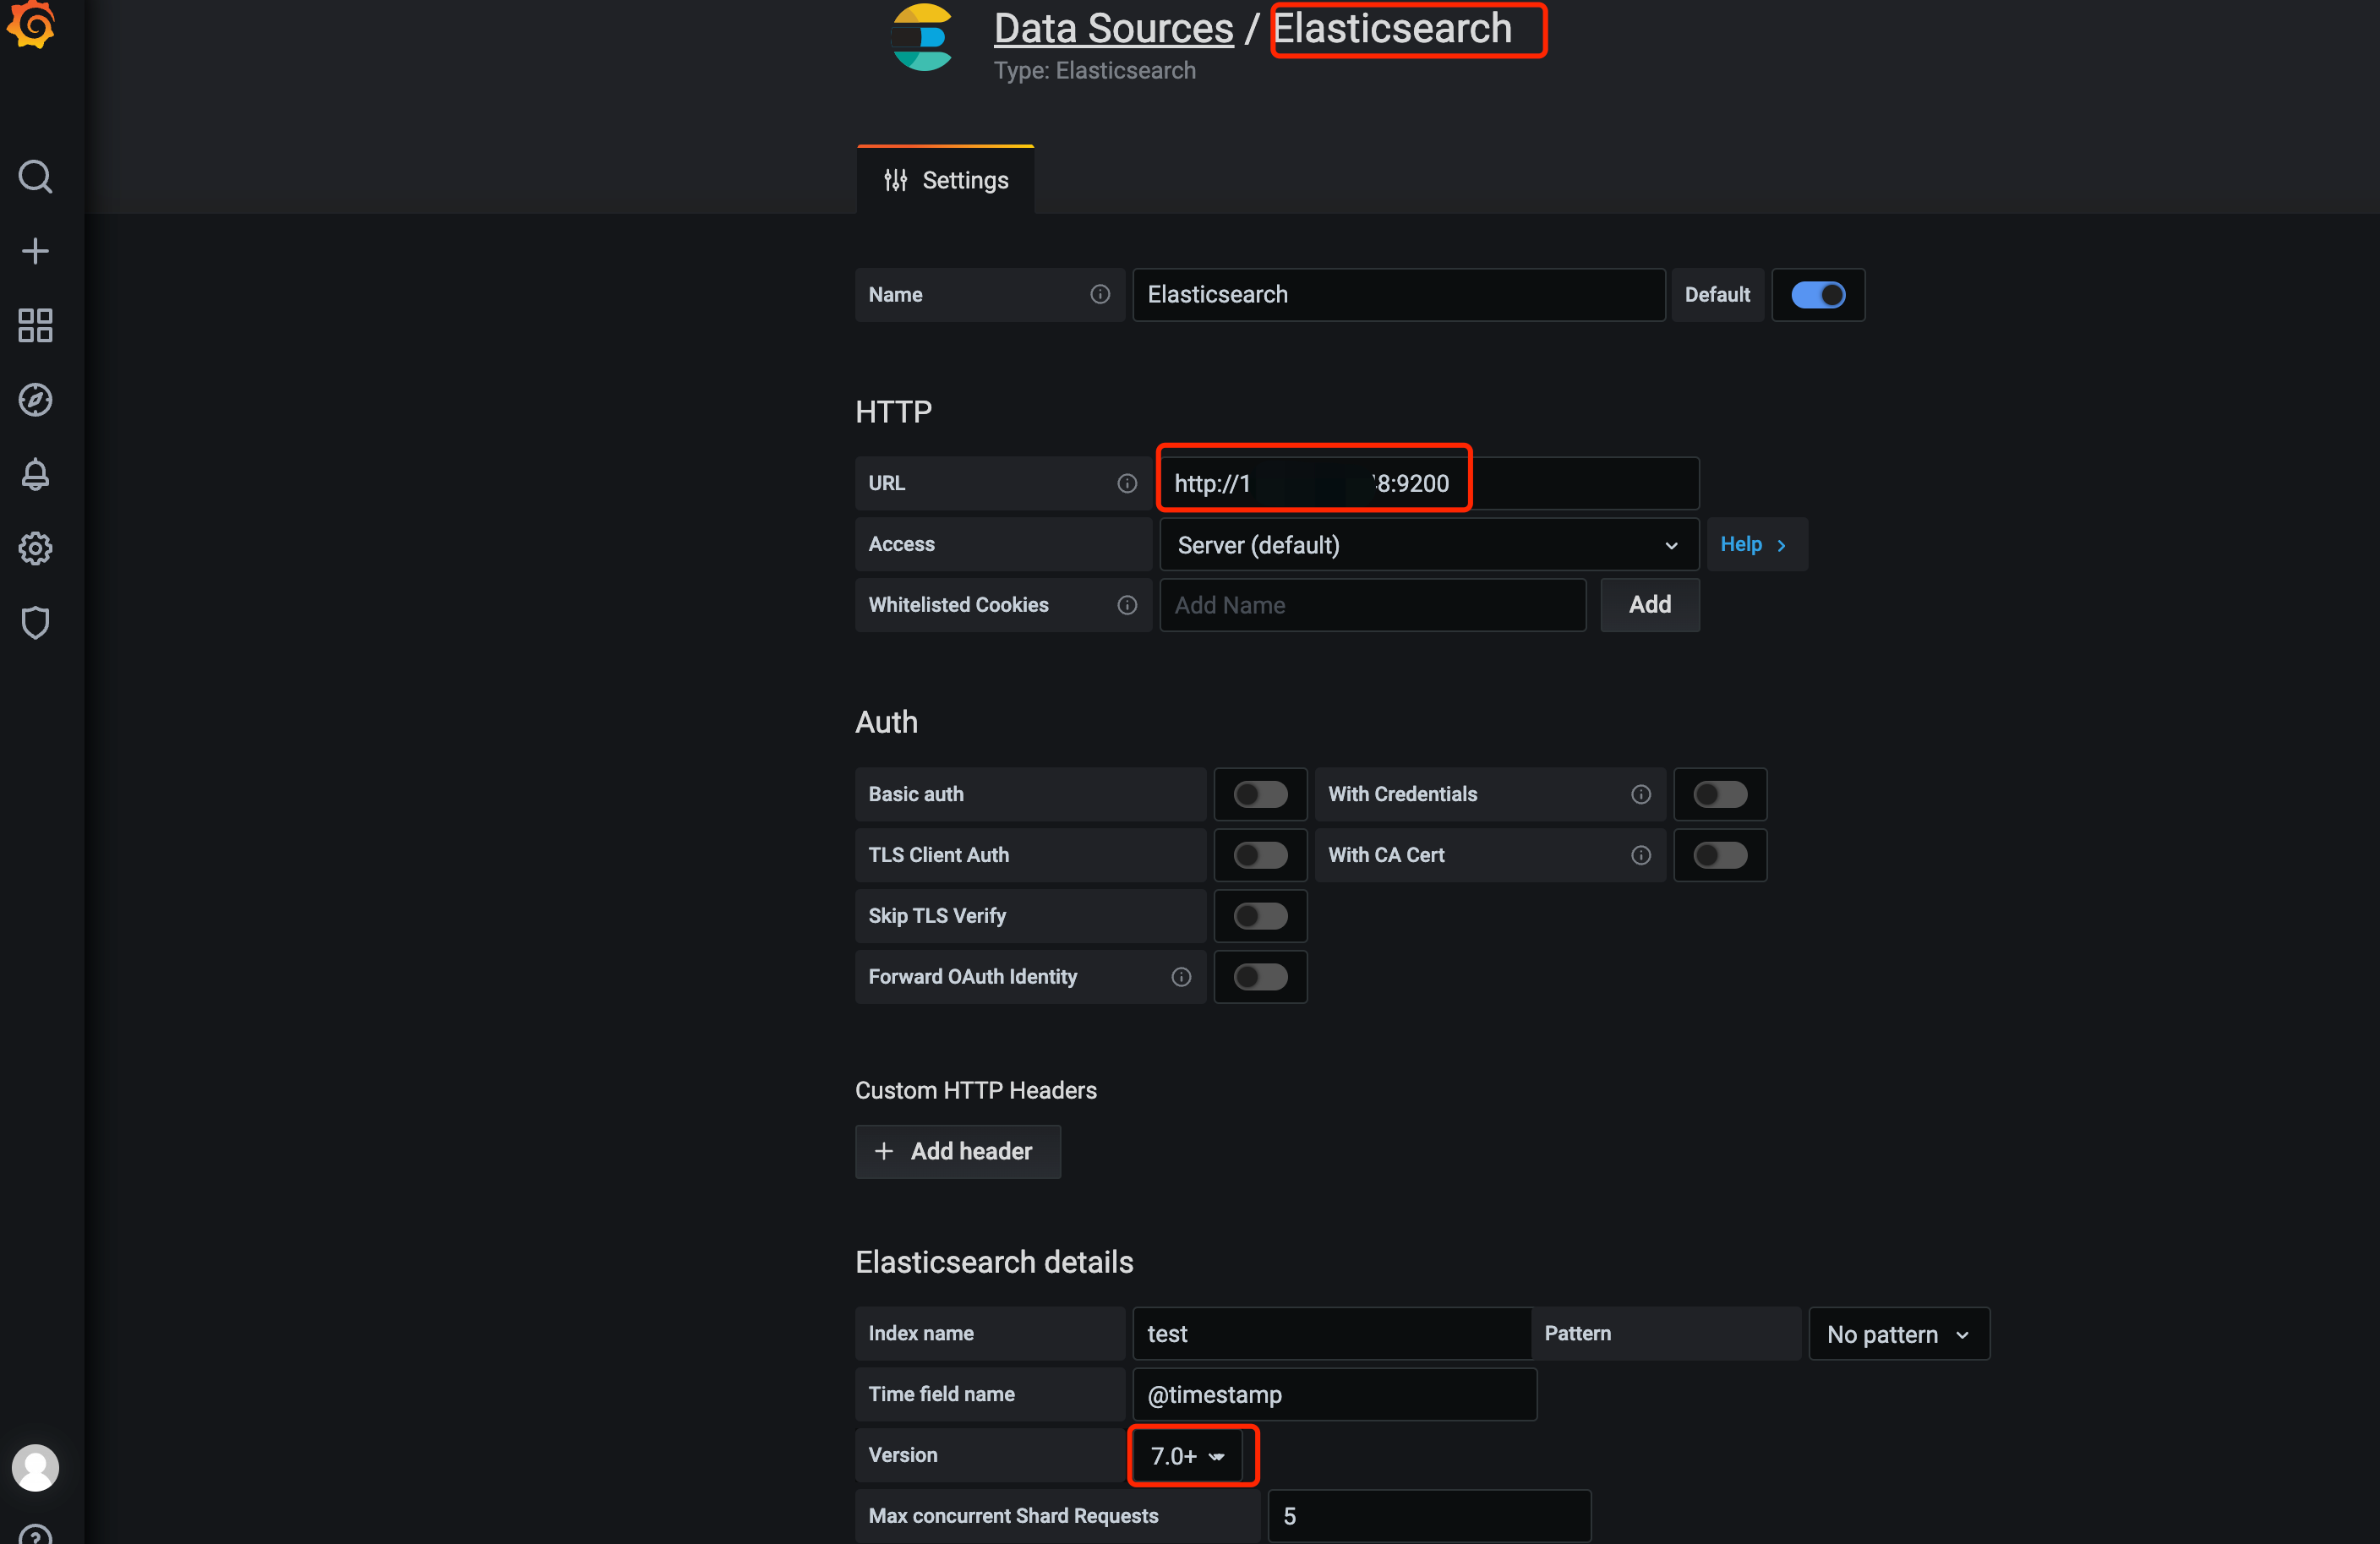
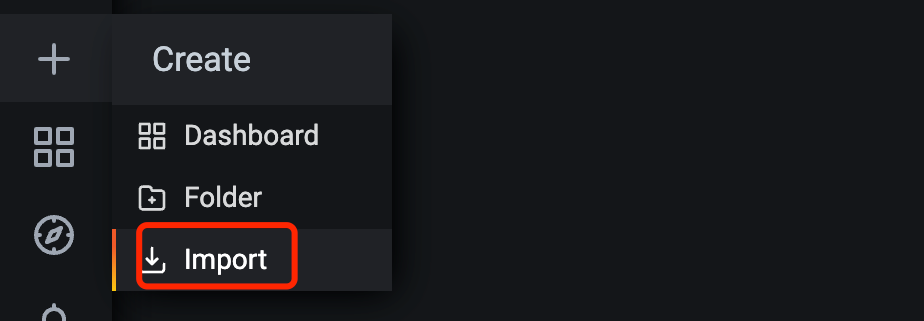
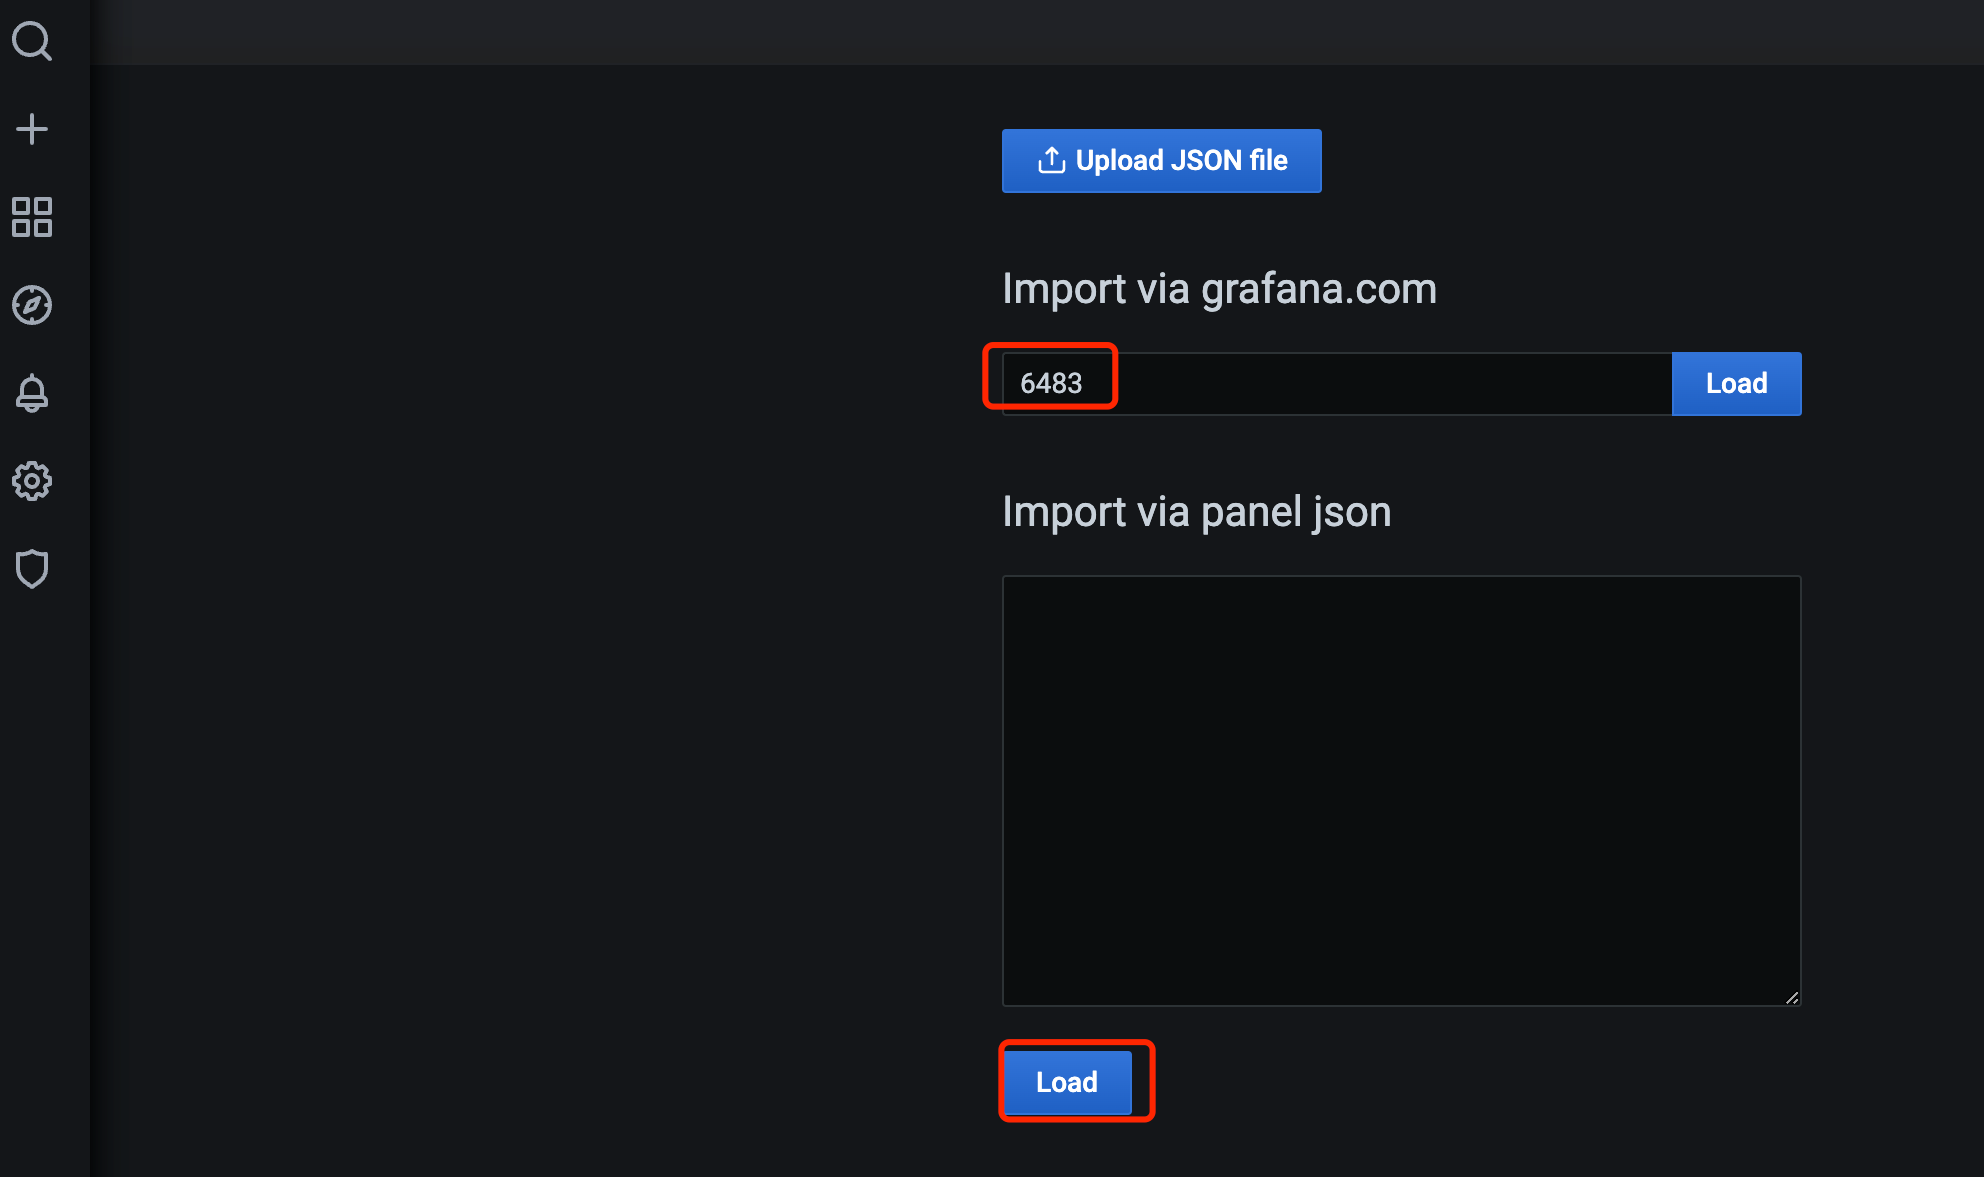
导入ES数据源和prometheus数据源
version根据ES集群版本选择


原创声明:本文系作者授权腾讯云开发者社区发表,未经许可,不得转载。
如有侵权,请联系 cloudcommunity@tencent.com 删除。
原创声明:本文系作者授权腾讯云开发者社区发表,未经许可,不得转载。
如有侵权,请联系 cloudcommunity@tencent.com 删除。
评论
登录后参与评论
推荐阅读
目录
相关产品与服务
Elasticsearch Service
腾讯云 Elasticsearch Service(ES)是云端全托管海量数据检索分析服务,拥有高性能自研内核,集成X-Pack。ES 支持通过自治索引、存算分离、集群巡检等特性轻松管理集群,也支持免运维、自动弹性、按需使用的 Serverless 模式。使用 ES 您可以高效构建信息检索、日志分析、运维监控等服务,它独特的向量检索还可助您构建基于语义、图像的AI深度应用。
腾讯云开发者
