使用StainedGlass的输出结果用R语言自己画三角形热图展示着丝粒的位置

使用StainedGlass的输出结果用R语言自己画三角形热图展示着丝粒的位置

用户7010445
发布于 2024-03-04 13:20:17
发布于 2024-03-04 13:20:17
StainedGlass论文
StainedGlass: interactive visualization of massive tandem repeat structures with identity heatmaps
代码链接 https://mrvollger.github.io/StainedGlass/ https://github.com/mrvollger/StainedGlass
利用基因组数据运行如下命令
snakemake -s ~/biotools/StainedGlass/workflow/Snakefile --configfile=/home/myan/biotools/StainedGlass/config/config.yaml --config sample=Arabidopsis fasta=/data/myan/raw_data/practice/stainedGlass/Col-CEN_v1.2.fasta --cores 24 make_figures -p
以上命令会生成 Arabidopsis.2000.10000.bed.gz 文件,所有染色体全部在这个文件里,软件生成的1号染色体的图
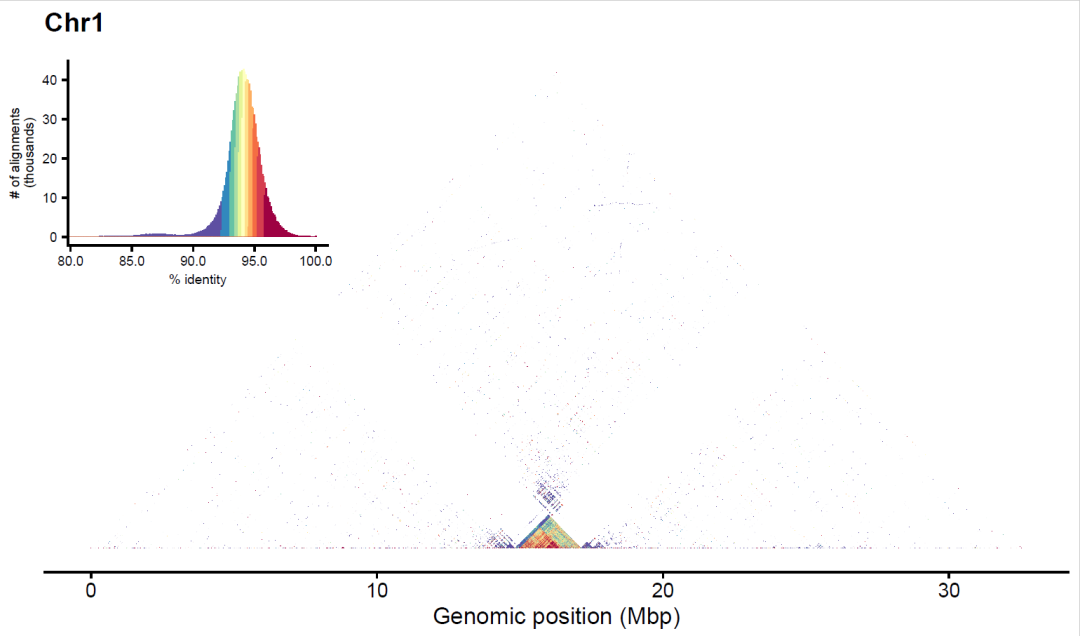
我们把1号染色体大概14M到19M的区间提取出来,自己作图
library(data.table)
library(tidyverse)
dat<-fread("Arabidopsis.2000.10000.bed.gz")
dat%>%filter(`#query_name`=="Chr1")%>%filter(reference_name=="Chr1")%>%write_tsv("Arabidopsis.Chr1.bed")
dat.at.chr1<-read_tsv("D:/Jupyter/practice/Arabidopsis.Chr1.bed")
dat.at.chr1 %>% colnames()
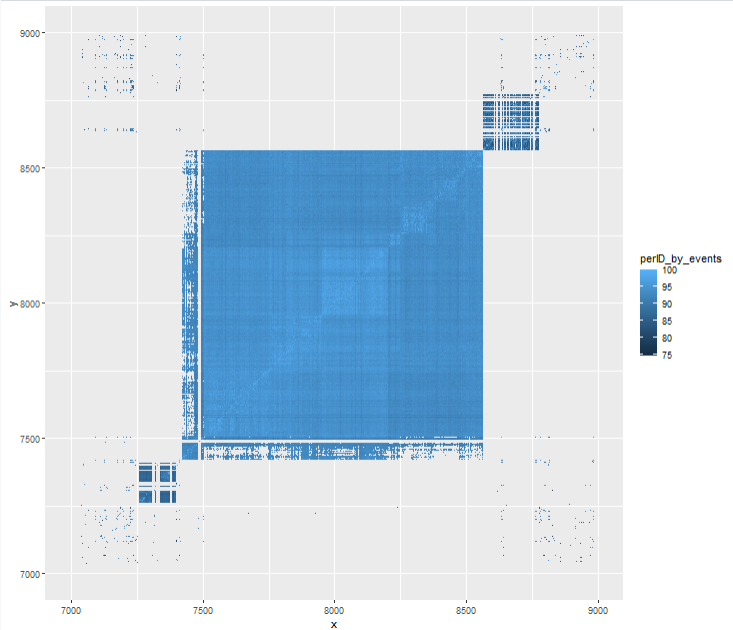
dat.at.chr1 %>%
filter(query_start>=14000000 & query_start<=18000000) %>%
filter(reference_start>=14000000 & reference_start <= 18000000) %>%
mutate(x=query_start/2000,
y=reference_start/2000) %>%
ggplot(aes(x=x,y=y))+
geom_tile(aes(fill=perID_by_events))
把这个图旋转90度,参考 公众号推文 矩形旋转问题之风波再起(老俊俊的生信笔记)这里用到了一个函数getRotatedPolygon 把原始数据进行转换(这里转换的逻辑我暂时还没想明白),这个函数来源于R包BioSeqUtils,我安装这个R包的时候遇到报错,DescTools 这个R包一直没有安装成功。暂时解决不了。不按照这个R包,把这个函数单独复制出来也可以用 https://github.com/junjunlab/BioSeqUtils/blob/master/R/createGraphFuncs.R
getRotatedPolygon <- function(data = NULL, rx = NULL, ry = NULL,
                              value = NULL,theta = 45, workers = 1,
                              window = 1) {
  # Convert theta to radians
  theta_rad <- pi * (theta / 180)

  # Set a "plan" for how the code should run.
  # future::plan(future::multisession, workers = workers)

  # Vectorize the operations
  data$x <- data[[rx]]
  data$y <- data[[ry]]
  data$xr <- data$x * cos(theta_rad) + data$y * sin(theta_rad)
  data$yr <- data$y * cos(theta_rad) - data$x * sin(theta_rad)
  data$xr <- data$xr * cos(theta_rad)
  data$yr <- data$yr * sin(theta_rad)

  data$yr <- round(data$yr,digits = 1)
  # Combine the results
  rotated_coods <- furrr::future_map_dfc(data, identity)

  # ============================================================================
  # check window size
  if(is.numeric(window)){
    window_size = window*0.5
  }else if(is.character(window)){
    window_size = rotated_coods[[window]]*0.5
  }else{
    message("please supply column name or numeric value!")
  }

  # get cordinates
  polygon_x <- cbind(rotated_coods$xr - window_size, rotated_coods$xr,
                     rotated_coods$xr + window_size, rotated_coods$xr)
  polygon_y <- cbind(rotated_coods$yr, rotated_coods$yr + window_size,
                     rotated_coods$yr, rotated_coods$yr - window_size)
  polygon_id <- rep(1:nrow(rotated_coods), 4)
  polygon_value <- rep(rotated_coods[[value]], 4)

  # polygon coords
  polygon_coods <- data.frame(xp = as.vector(polygon_x),
                              yp = as.vector(polygon_y),
                              id = polygon_id,
                              value = polygon_value)

  # ============================================================================
  # output
  return(list(rotated_coods = rotated_coods,
              polygon_coods = polygon_coods))
}
把数据做一个转化
dat.at.chr1 %>%
  filter(query_start>=14000000 & query_start<=18000000) %>%
  filter(reference_start>=14000000 & reference_start <= 18000000) %>%
  mutate(x=query_start/2000,
         y=reference_start/2000) %>%
  select(x,y,perID_by_events) %>%
  pivot_wider(names_from = "y",values_from = "perID_by_events") %>%
  mutate_all(~replace(.,is.na(.),0)) %>%
  pivot_longer(!x,names_to = "y") %>%
  mutate(y=as.numeric(y)) -> new.dat
这里query_start/2000 2000是步长
new.dat %>%
  ggplot(aes(x=x,y=y))+
  geom_tile(aes(fill=value))
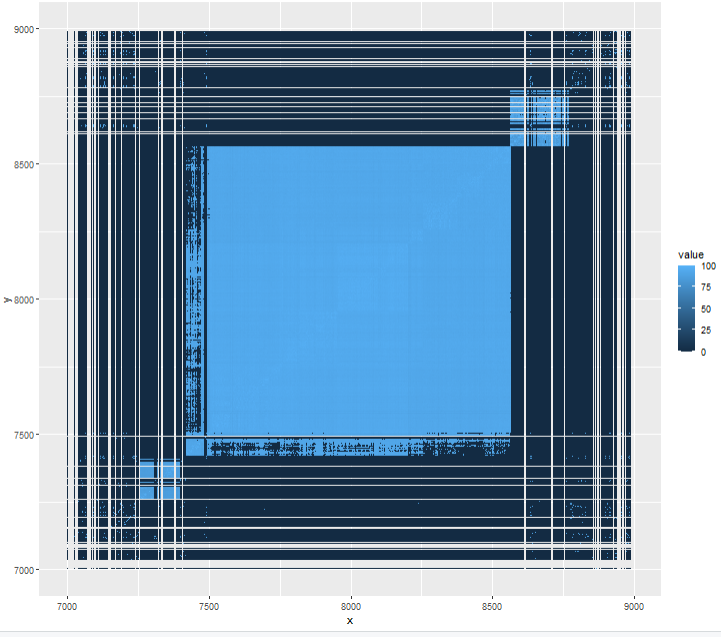
这个图里有很多0,最深蓝色的位置都是0,可以把这些0全部过滤掉
dfr <- getRotatedPolygon(data = new.dat,rx = 'x',ry = 'y',value = 'value',
                         workers = 1,window = 1)
jpeg(file = "abc.jpeg")
ggplot() +
  geom_polygon(data = dfr$polygon_coods %>% filter(value>0),
               aes(x = xp,y = yp,group = id,fill=value),
               color = NA) +
  #ylim(0,NA)+
  coord_equal()
dev.off()
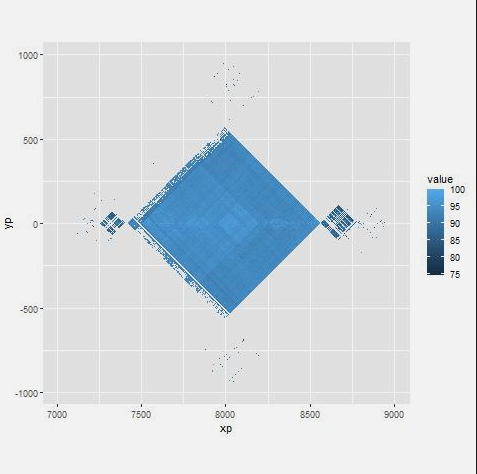
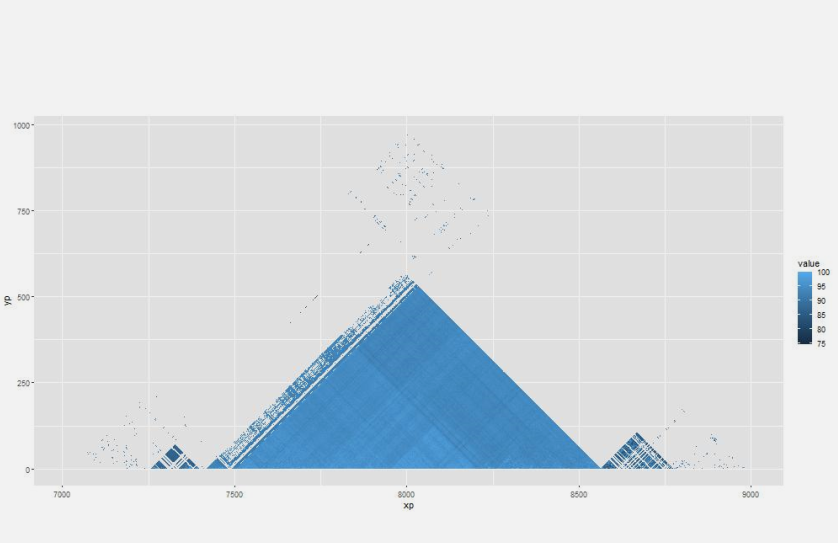
如果要上三角,就把y值设置为大于0,如果要下三角就把y值设置小于0
jpeg(file = "abc1.jpeg",width = 1000,height = 1000)
ggplot() +
  geom_polygon(data = dfr$polygon_coods %>% filter(value>0),
               aes(x = xp,y = yp,group = id,fill=value),
               color = NA) +
  #ylim(0,NA)+
  coord_equal()+
  scale_y_continuous(limits = c(0,NA))
dev.off()
StainedGlass 自带的画图脚本是把连续的值离散化了,离散化的函数是
ncolors <- 11
get_colors <- function(sdf) {
  bot <- floor(min(sdf$perID_by_events))
  top <- 100
  breaks <- unique(c(quantile(sdf$perID_by_events, probs = seq(0, 1, by = 1 / ncolors))))
  labels <- seq(length(breaks) - 1)
  # corner case of only one %id value
  if (length(breaks) == 1) {
    return(factor(rep(1, length(sdf$perID_by_events))))
  }
  return(cut(sdf$perID_by_events, breaks = breaks, labels = labels, include.lowest = TRUE))
}
稍微修改一下
get_colors <- function(x) {
  ncolors <- 11
  bot <- floor(min(x))
  top <- 100
  breaks <- unique(c(quantile(x, probs = seq(0, 1, by = 1 / ncolors))))
  labels <- seq(length(breaks) - 1)
  # corner case of only one %id value
  if (length(breaks) == 1) {
    return(factor(rep(1, length(x))))
  }
  return(cut(x, breaks = breaks, labels = labels, include.lowest = TRUE))
}
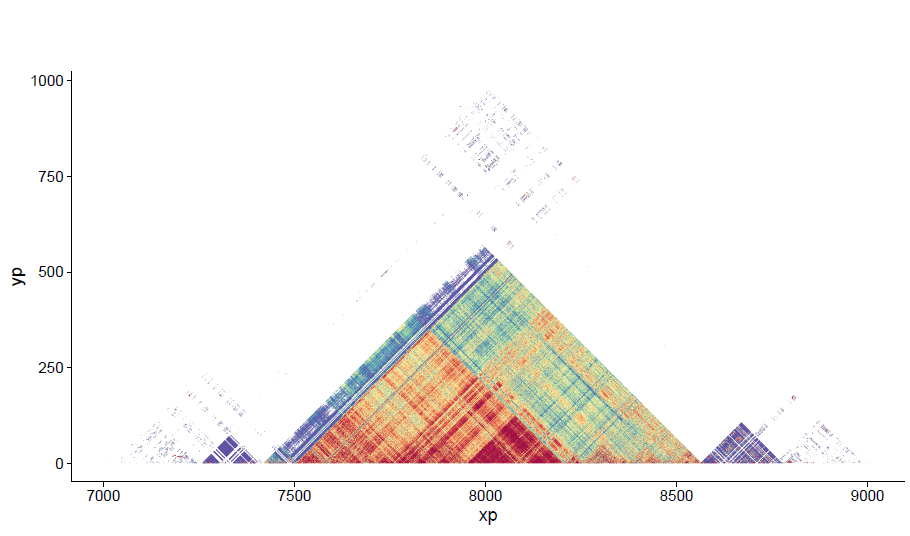
作图代码
dfr$polygon_coods %>% filter(value>0) %>%
  mutate(new_value=get_colors(value)) -> new.df.polygon_coods

jpeg(file = "abc3.jpeg",width = 1000,height = 1000)
ggplot() +
  geom_polygon(data=new.df.polygon_coods,
               aes(x = xp,y = yp,group = id,fill=new_value),
               color = NA) +
  #ylim(0,NA)+
  coord_equal()+
  scale_y_continuous(limits = c(0,NA))+
  cowplot::theme_cowplot() +
  scale_fill_brewer(palette = "Spectral", direction = -1) +
  theme(legend.position = "none")
dev.off()

pdf(file = "abc3.pdf",width = 10,height = 10)
ggplot() +
  geom_polygon(data=new.df.polygon_coods,
               aes(x = xp,y = yp,group = id,fill=new_value),
               color = NA) +
  #ylim(0,NA)+
  coord_equal()+
  scale_y_continuous(limits = c(0,NA))+
  cowplot::theme_cowplot() +
  scale_fill_brewer(palette = "Spectral", direction = -1) +
  theme(legend.position = "none")
dev.off()
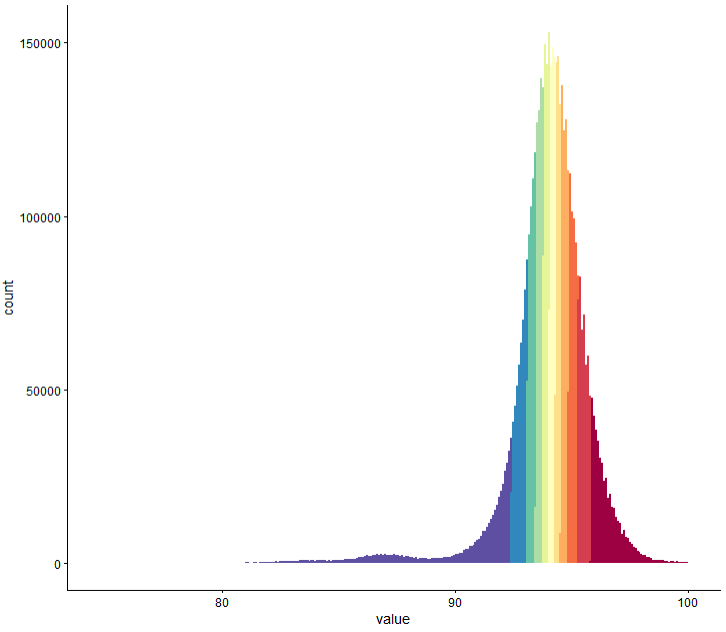
左上角的图
ggplot(data = new.df.polygon_coods,
       aes(value, fill = new_value)) +
  geom_histogram(bins = 300) +
  cowplot::theme_cowplot() +
  scale_fill_brewer(palette = "Spectral", direction = -1) +
  theme(legend.position = "none")
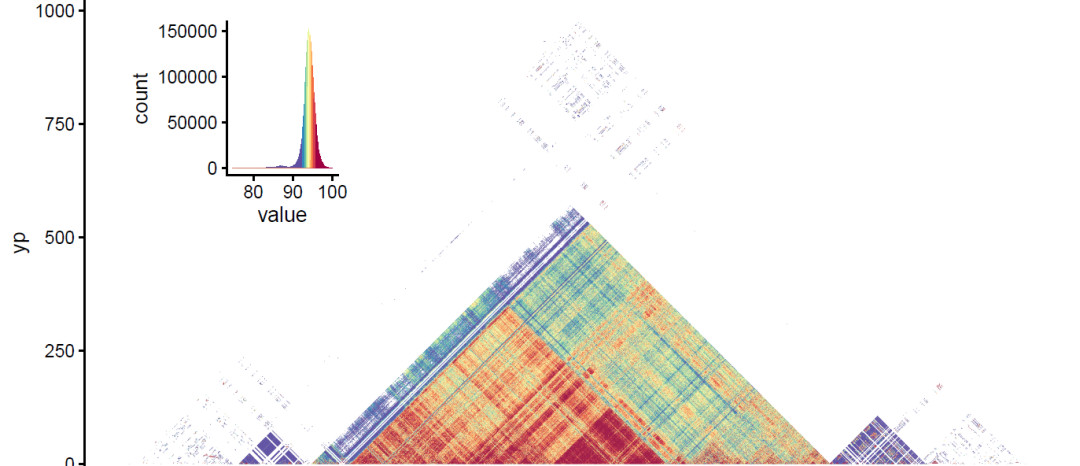
把两个图组合到一起
p_lone<-ggplot() +
  geom_polygon(data=new.df.polygon_coods,
               aes(x = xp,y = yp,group = id,fill=new_value),
               color = NA) +
  #ylim(0,NA)+
  coord_equal()+
  scale_y_continuous(limits = c(0,NA))+
  cowplot::theme_cowplot() +
  scale_fill_brewer(palette = "Spectral", direction = -1) +
  theme(legend.position = "none")


p_hist<-ggplot(data = new.df.polygon_coods,
       aes(value, fill = new_value)) +
  geom_histogram(bins = 300) +
  cowplot::theme_cowplot() +
  scale_fill_brewer(palette = "Spectral", direction = -1) +
  theme(legend.position = "none")

pdf(file = "abc4.pdf",width = 10,height = 10)
plot <- p_lone + annotation_custom(
  ggplotGrob(p_hist),
  xmin = 7000, xmax = 7500,
  ymin = 500, ymax = 1000
)
print(plot)
dev.off()
其他知识点 R语言数据框填充缺失值
https://stackoverflow.com/questions/8161836/how-do-i-replace-na-values-with-zeros-in-an-r-dataframe
dat<-data.frame(x=c(1,2,NA),y=c(4,NA,6),z=c(NA,8,9))
dat

dat %>%
  mutate_all(~replace(.,is.na(.),0))

dat %>%
  replace_na(list(x=0,y=100,z=1000))
如果是字符变量带因子水平填充缺失值会失败,需要把因子水平去掉
本文参与 腾讯云自媒体同步曝光计划,分享自微信公众号。
原始发表:2024-02-27,如有侵权请联系 cloudcommunity@tencent.com 删除
评论
登录后参与评论
推荐阅读
目录
腾讯云开发者

Copyright © 2013 - 2026 Tencent Cloud. All Rights Reserved. 腾讯云 版权所有
深圳市腾讯计算机系统有限公司 ICP备案/许可证号:粤B2-20090059 ![]() 粤公网安备44030502008569号
粤公网安备44030502008569号
腾讯云计算(北京)有限责任公司 京ICP证150476号 | 京ICP备11018762号