R语言ggplot2散点图如何使用更多的形状

R语言ggplot2散点图如何使用更多的形状

用户7010445
发布于 2024-04-23 12:16:42
发布于 2024-04-23 12:16:42
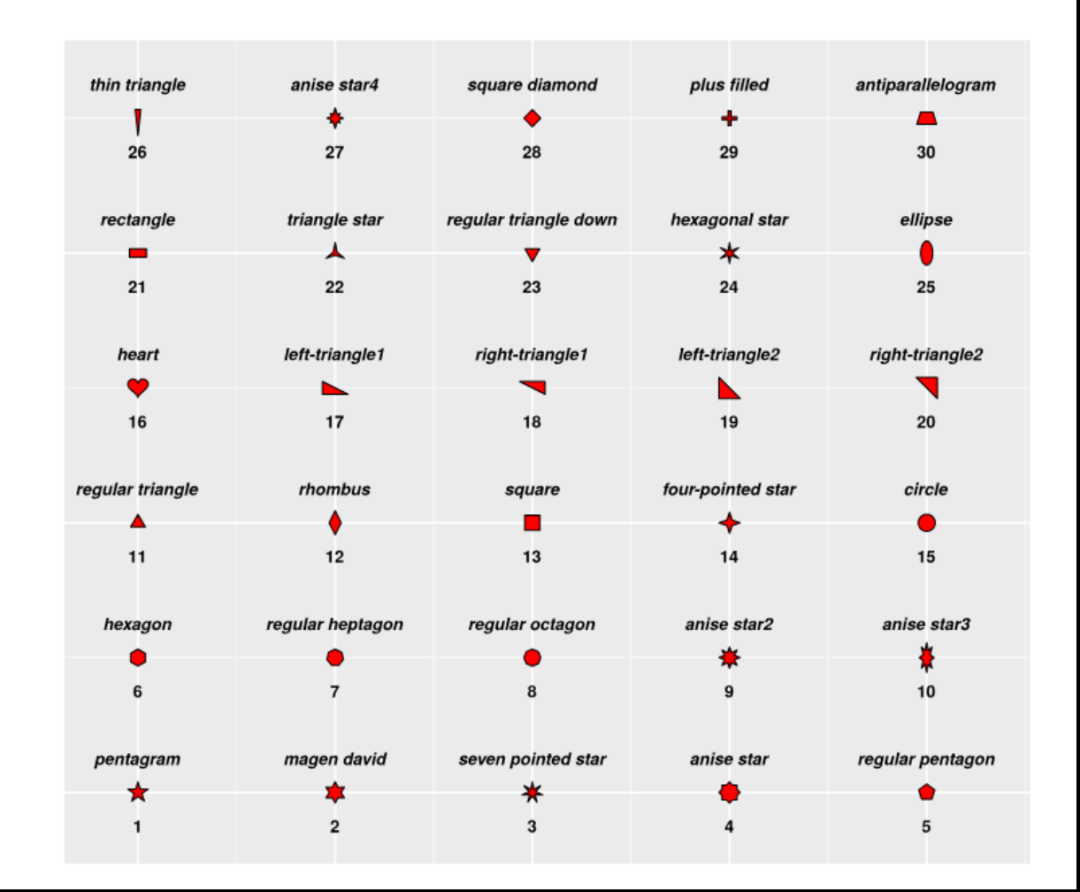
R语言ggplot2如果要做散点图可以用自带的一些形状

如果想用其他形状,有一个R包是ggstar https://cran.r-project.org/web/packages/ggstar/vignettes/ggstar.html
如果还想用其他形状,可以修改ggstar的代码,来增加一些形状。ggstar这个R包的整体结构暂时还看不明白,但是定义形状的部分自己能够修改。
在 primitive.R 代码中 plxy 就是一个形状的数据,第一列是x,第二列是y
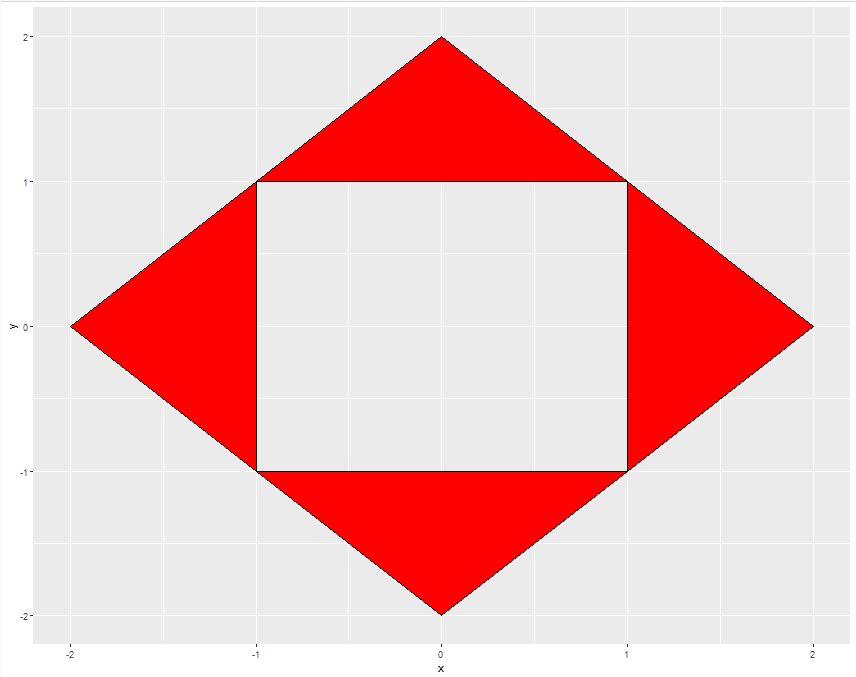
比如上图中28的形状 square diamond 把中心掏出一正方形的空白
data.frame(x=c(0,-1,-2,-1,0,1,2,1,-1,-1,1,1,0),
           y=c(2,1,0,-1,-2,-1,0,1,1,-1,-1,1,2)) %>%
  ggplot()+
  geom_polygon(aes(x=x,y=y),fill="red",color="black")
在 primitive.R 代码中添加上一段代码
else if (starshape == 28){
    data.frame(x=c(0,-1,-2,-1,0,1,2,1,-1,-1,1,1,0),
               y=c(2,1,0,-1,-2,-1,0,1,1,-1,-1,1,2)) %>%
      as.matrix() -> plxy
  }
作图代码
source("ggstar02/draw_key.R")
source("ggstar02/geom_star.R")
source("ggstar02/primitive.R")
source("ggstar02/utilities.R")

library(grid)
library(gridExtra)
library(tidyverse)

ggplot(data=data.frame(x=1:5,y=2,group=c("A","A","A","B","B")),
       aes(x=x,y=y))+
  geom_star(starshape=28,angle=90,size=10,
            aes(fill=group),
            show.legend = FALSE)+
  theme_bw()+
  theme(panel.grid = element_blank())

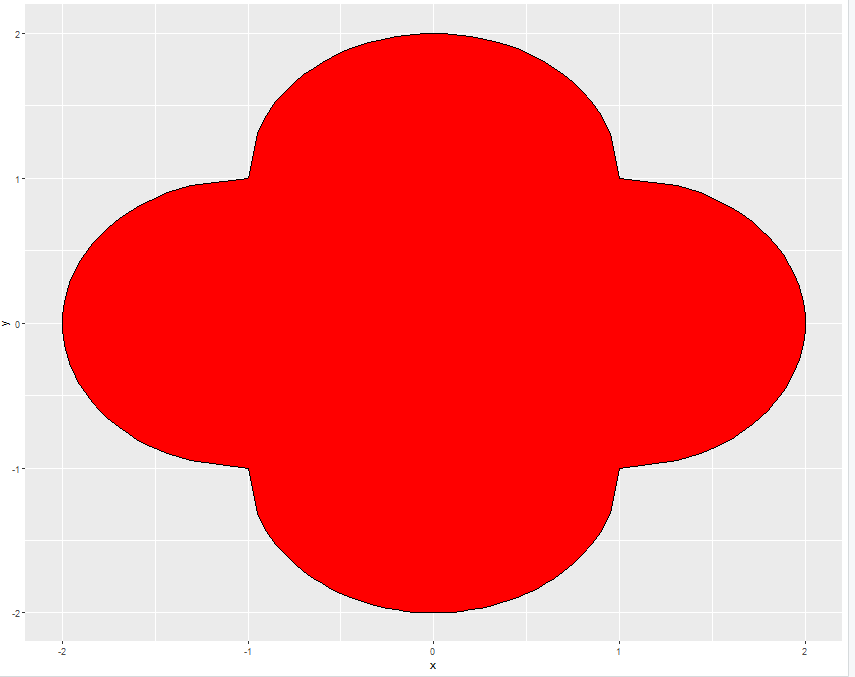
定义一个四瓣的花瓣
x1<-seq(-1,1,by=0.05)
y1<-sqrt(1-x1^2)
y2<-seq(-1,1,by=0.05)
x2<-sqrt(1-y2^2)

data.frame(x=c(x1,x2+1,-x1,-x2-1),
           y=c(y1+1,-y2,-y1-1,y2)) %>%
  ggplot(aes(x=x,y=y))+
  geom_polygon(fill="red",color="black")
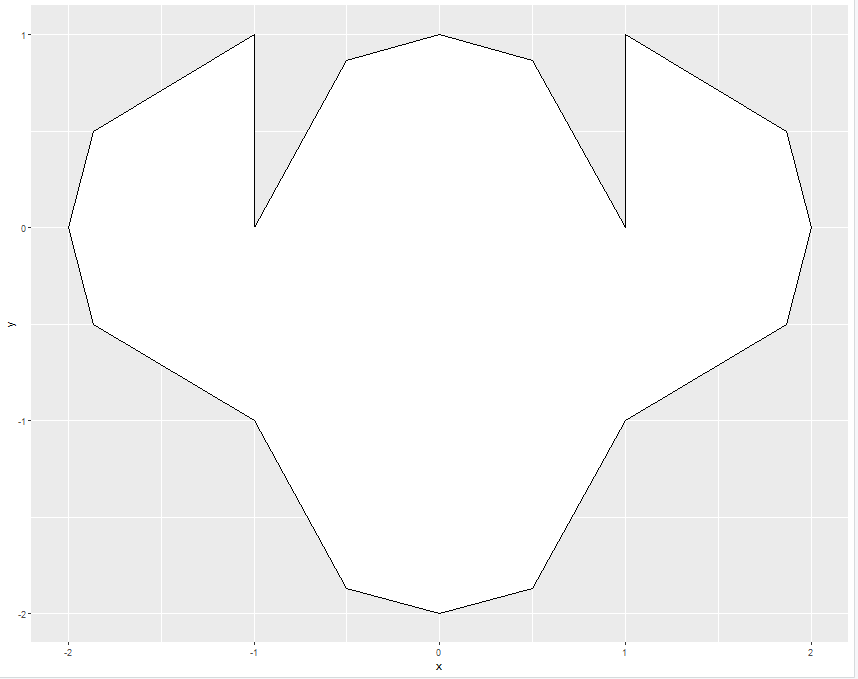
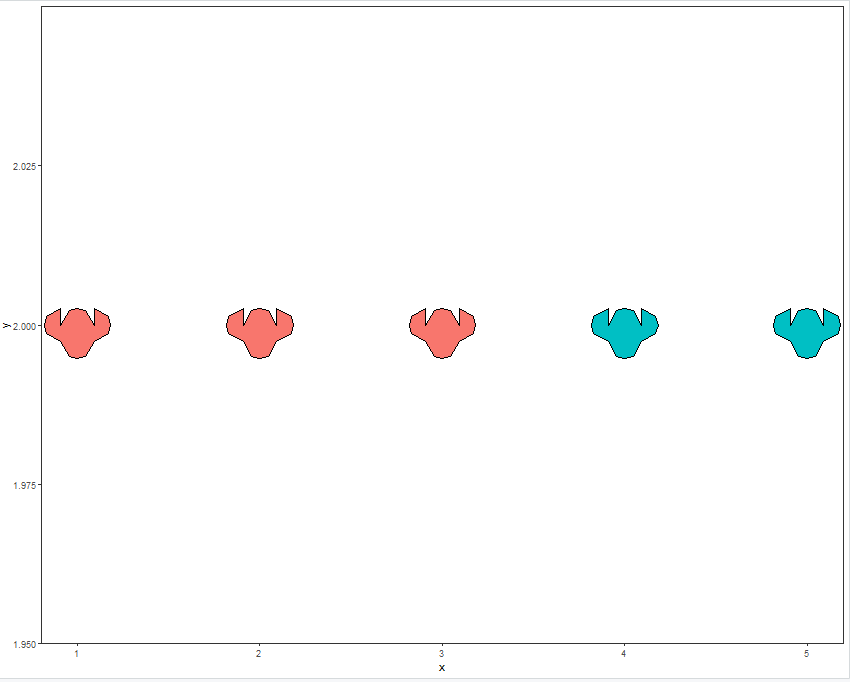
一个牛头的形状
x1<-seq(-1,1,by=0.5)
y1<-sqrt(1-x1^2)
y2<-seq(-1,1,by=0.5)
x2<-sqrt(1-y2^2)

data.frame(x=c(x1,x2+1,-x1,-x2-1),
           y=c(y1,-y2,-y1-1,y2)) %>%
  ggplot(aes(x=x,y=y))+
  geom_polygon(fill="white",color="black")
ggplot(data=data.frame(x=1:5,y=2,group=c("A","A","A","B","B")),
       aes(x=x,y=y))+
  geom_star(starshape=15,angle=0,size=10,
            aes(fill=group),
            show.legend = FALSE)+
  theme_bw()+
  theme(panel.grid = element_blank())
ggplot(data=data.frame(x=1:5,y=2,group=c("A","A","A","B","B")),
       aes(x=x,y=y))+
  geom_star(starshape=5,angle=0,size=10,
            aes(fill=group),
            show.legend = FALSE)+
  theme_bw()+
  theme(panel.grid = element_blank())

基本上能构造出形状的坐标,就能够把这个形状用于ggplot2的散点图中

本文参与 腾讯云自媒体同步曝光计划,分享自微信公众号。
原始发表:2024-04-22,如有侵权请联系 cloudcommunity@tencent.com 删除
评论
登录后参与评论
推荐阅读
腾讯云开发者

Copyright © 2013 - 2026 Tencent Cloud. All Rights Reserved. 腾讯云 版权所有
深圳市腾讯计算机系统有限公司 ICP备案/许可证号:粤B2-20090059 ![]() 粤公网安备44030502008569号
粤公网安备44030502008569号
腾讯云计算(北京)有限责任公司 京ICP证150476号 | 京ICP备11018762号