如何用整数绘制热图混淆矩阵
提问于 2022-02-24 01:45:15
我正在绘制这样的混淆矩阵:
from sklearn.linear_model import LogisticRegression
#Initalize the classifier
clf = LogisticRegression(random_state=0)
#Fitting the training data
clf.fit(X_train, y_train)
#Predicting on test
y_pred=clf.predict(X_test)

from sklearn.metrics import confusion_matrix
from sklearn.metrics import classification_report
print(confusion_matrix(y_test, y_pred))
print(classification_report(y_test, y_pred))

print(f'Accuracy = {accuracy_score(y_test, y_pred):.2f}\nRecall = {recall_score(y_test, y_pred):.2f}\n')
cm = confusion_matrix(y_test, y_pred)
cm_plot = sns.heatmap(cm, annot=True, cmap='Blues');
cm_plot.set_xlabel('Predicted Values')
cm_plot.set_ylabel('Actual Values')
cm_plot.set_title('Confusion Matrix (with SMOTE)', size=16)
我得到了这个结果:
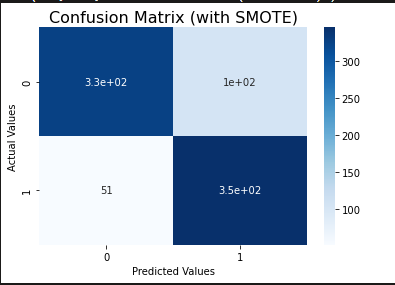
但当实数混淆矩阵值时,它显示的数字类似于3.3e+02:
[[327 103]
 [ 51 346]]
我如何在热图中画出真实的数字?

回答 1
Stack Overflow用户
回答已采纳
发布于 2022-02-24 01:59:36
看来你在用海航绘制你的热图。您可以使用seaborn.heatmap's fmt参数格式化数字。做cm_plot = sns.heatmap(cm, annot=True, cmap='Blues', fmt='d')应该有效。
页面原文内容由Stack Overflow提供。腾讯云小微IT领域专用引擎提供翻译支持
原文链接:
https://stackoverflow.com/questions/71249994
复制


腾讯云开发者
