这个肝癌单细胞数据集居然真的有这么多NK细胞亚群啊!!!


根据生信技能树发布的学徒作业:SingleR说是NK细胞你就相信了吗, 验证一下看真的是有这么多NK细胞
首先读取数据,然后降维分群
library(Seurat)
library(dplyr)
library(stringr)
library(harmony)
rm(list = ls())
filename <- paste('rawdata/',list.files('rawdata/'),sep = '')
sceList <- lapply(filename, function(x){
obj <- CreateSeuratObject(counts = Read10X(x),
project = str_split(x,'/')[[1]][2])
})
names(sceList) <- list.files('rawdata/')
sce <- merge(sceList[[1]],sceList[-1],add.cell.ids = names(sceList))
dim(sce) # 33538个gene, 44434个cell
grep('^MT',x=rownames(sce@assays$RNA@data),value = T)
grep('^RP[SL]',x=rownames(sce@assays$RNA@data),value = T)
sce <- PercentageFeatureSet(sce,pattern = '^MT',col.name = 'percent.MT')
VlnPlot(sce,features = 'percent.MT',pt.size = 0)
VlnPlot(sce,features = 'nCount_RNA',pt.size = 0)
VlnPlot(sce,features = 'nFeature_RNA',pt.size = 0)
sce <- subset(sce,subset = nCount_RNA>3000 & nFeature_RNA>300 & percent.MT<25)
dim(sce) # 33538*24494
sce <- sce[rowSums(sce@assays$RNA@counts>0)>3,]
dim(sce) # 20389*24494
sce <- NormalizeData(sce)
sce <- FindVariableFeatures(sce)
sce <- ScaleData(sce)
sce <- RunPCA(sce)
DimPlot(sce,reduction = 'pca',group.by = 'orig.ident')
sce <- RunHarmony(sce,group.by.vars = 'orig.ident')
ElbowPlot(sce,reduction = 'harmony',ndims = 30)
sce <- RunUMAP(sce,dims = 1:15,reduction = 'harmony')
DimPlot(sce,reduction = 'umap',label = T,group.by = 'orig.ident')
sce <- FindNeighbors(sce,reduction = 'harmony',dims = 1:15)
sce <- FindClusters(sce,resolution = 0.5)
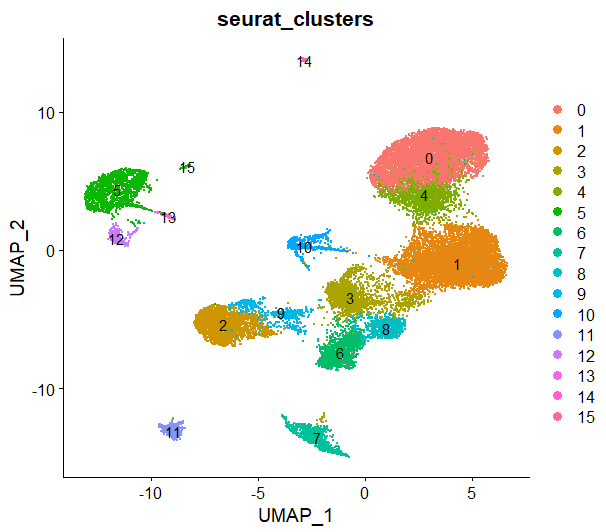
DimPlot(sce,reduction = 'umap',group.by = 'seurat_clusters',label = T)
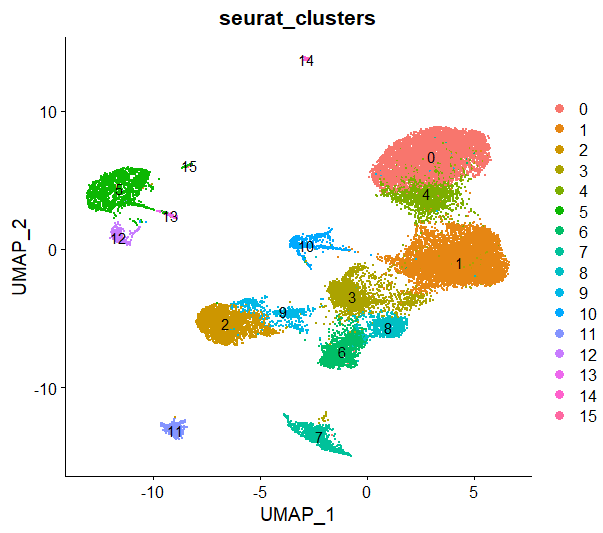
然后用marker gene进行细胞注释
# 免疫细胞 0,1,2,3,4,5,6,7,8,9,10,11,12,13,15(7和14不是)
DotPlot(sce,features = c('PTPRC','CD45'))
# T细胞 [3],6,8,9,10
DotPlot(sce,features = c('CD3D','CD3E','CD8A', 'CD8B'))
# B细胞 11
DotPlot(sce,features = c('CD79A', 'CD37', 'CD19', 'CD79B', 'MS4A1','CD20'))
# 浆细胞 7
DotPlot(sce,features = c('IGHG1','MZB1','SDC1','CD79A'))
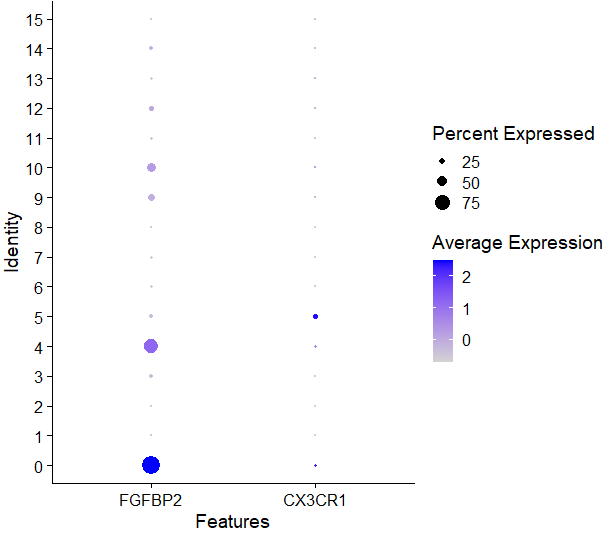
# NK细胞 0,4
DotPlot(sce,features = c('FGFBP2','FCG3RA','CX3CR1'))
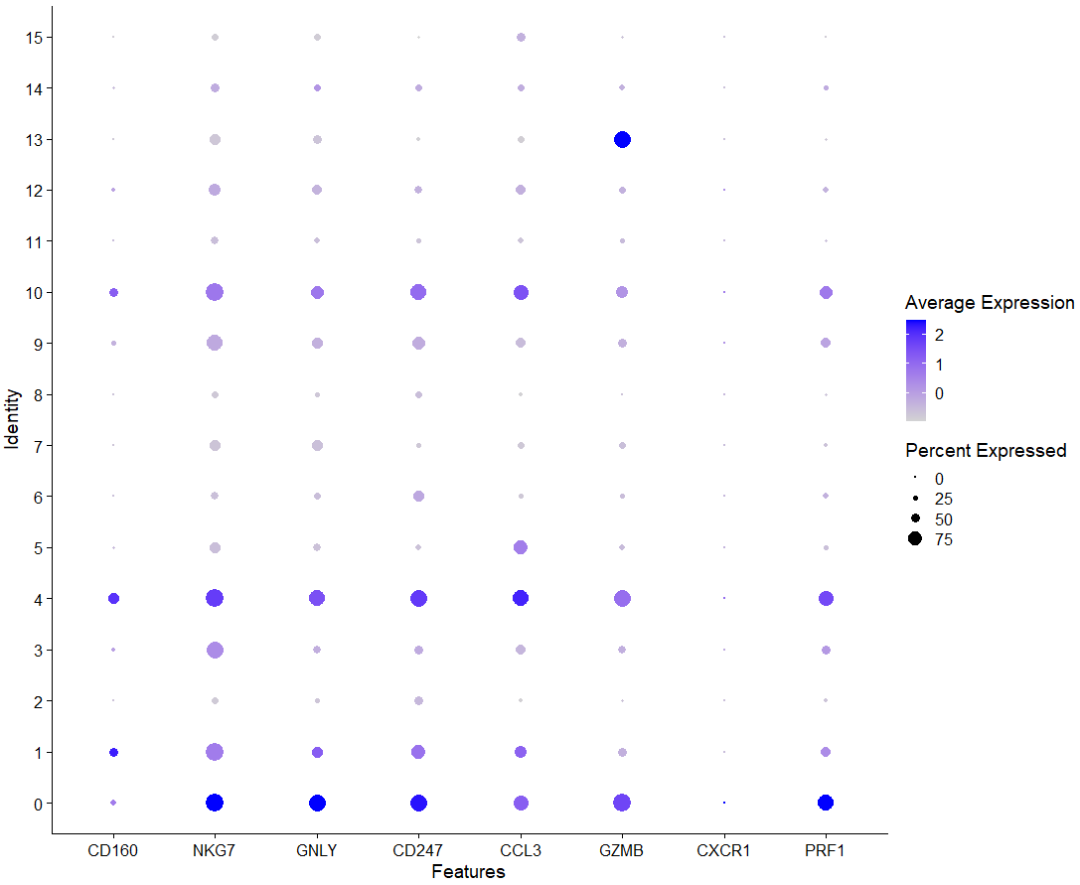
# NK细胞 0,1,3,4,9,10,13
DotPlot(sce,features = c('CD160','NKG7','GNLY','CD247','CCL3','GZMB','CXCR1','TYOB','PRF1'))
# 内皮细胞 5,15
DotPlot(sce,features = c('PECAM1','VWF'))
# 成纤维细胞 12,13
DotPlot(sce,features = c('FGF7','MME','DCN','LUM','GSN','PF4','PPBP'))
# 上皮细胞 11,[14]
DotPlot(sce,features = c('EPCAM','KRT19','PROM1','ALDH1A1','CD24'))
# 单核细胞和巨噬细胞 5,12,13,15
DotPlot(sce,features = c('CD68','CD163','CD14','LYZ'))
# memery T 2,6,8,9
DotPlot(sce,features = c('IL7R','S100A4'))
marker <- data.frame(cluster = 0:15,cell = 0:15)
marker[marker$cluster %in% c(0,1,2,3,4,5,6,8,9,10,11,12,13,15),2] <- 'Immune cells'
marker[marker$cluster %in% c(3,6,8,9,10),2] <- 'T cells'
marker[marker$cluster %in% c(11),2] <- 'B cells'
marker[marker$cluster %in% c(7),2] <- 'plasma cells'
marker[marker$cluster %in% c(0,1,3,4,10,13),2] <- 'NK cells'
marker[marker$cluster %in% c(5,15),2] <- 'Endothelial cells'
marker[marker$cluster %in% c(12,13),2] <- 'fibroblast'
marker[marker$cluster %in% c(14),2] <- 'epithelial cell'
marker[marker$cluster %in% c(5),2] <- 'monocyte'
marker[marker$cluster %in% c(2),2] <- 'memery T'
sce@meta.data$cell_type <- sapply(sce@meta.data$seurat_clusters,function(x){marker[x,2]})
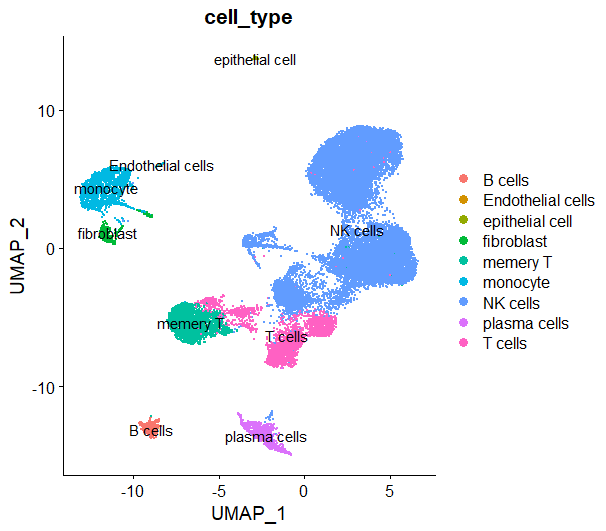
DimPlot(sce,reduction = 'umap',group.by = 'cell_type',label = T)
这里我把0,1,3,4,10,13注释为NK细胞
看看NK细胞的marker
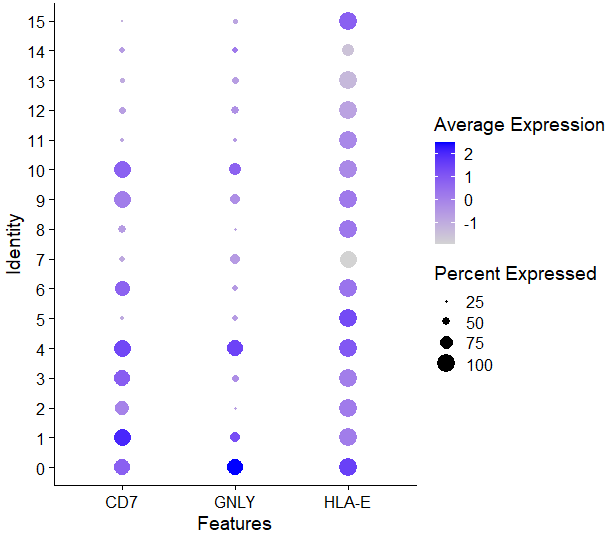
再上cellmarker看一下肝癌里NK细胞的marker
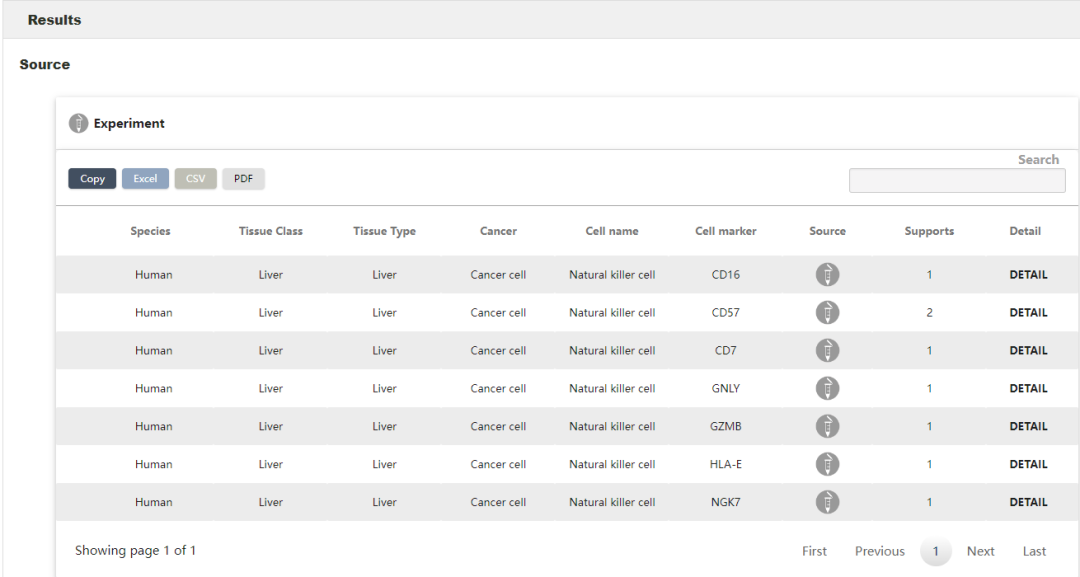
DotPlot(sce,features = c('CD16','CD57','CD7','GNLY','GZM8','HLA-E','NGK7'))
发现确实在很多cluster里都有表达,0,1,2,3,4,6,9,10
# singleR
library(SingleR)
library(celldex)
hpca.se <- HumanPrimaryCellAtlasData()
anno <- SingleR(sce@assays$RNA@data,
                ref = hpca.se,
                labels = hpca.se$label.main,
                clusters = sce@meta.data$seurat_clusters)
sce@meta.data$singleR_label <- unlist(lapply(sce@meta.data$seurat_clusters, function(x){anno$labels[x]}))
DimPlot(sce,reduction = 'umap',group.by = 'singleR_label',label = T)
用singleR进行注释,这里它把0,1,2,3,4,7,9,10,12,13都注释为NK cell
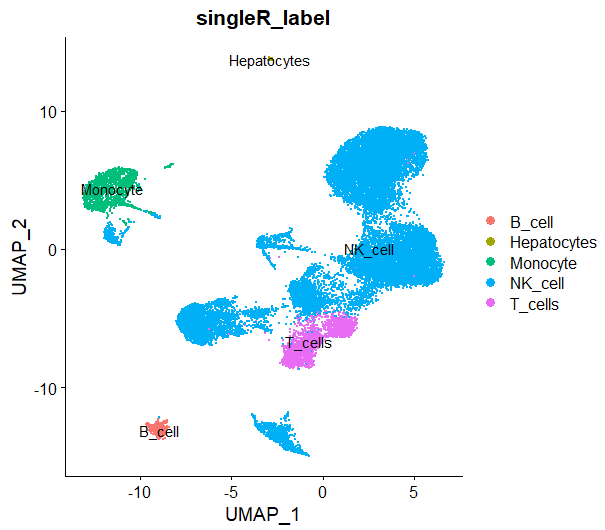
最后发现:相比手动注释的结果,它把部分B细胞,部分T细胞都归类为NK细胞,但是整体而言,无论是人工注释还是自动注释,这个数据里NK细胞确实占比较高
本文参与 腾讯云自媒体同步曝光计划,分享自微信公众号。
原始发表:2023-08-09,如有侵权请联系 cloudcommunity@tencent.com 删除
评论
登录后参与评论
推荐阅读
腾讯云开发者

Copyright © 2013 - 2026 Tencent Cloud. All Rights Reserved. 腾讯云 版权所有
深圳市腾讯计算机系统有限公司 ICP备案/许可证号:粤B2-20090059 ![]() 粤公网安备44030502008569号
粤公网安备44030502008569号
腾讯云计算(北京)有限责任公司 京ICP证150476号 | 京ICP备11018762号