R用户要整点python[系列完结]
R用户要整点python[系列完结]

1.插播:像Rstudio那样逐行运行代码
对spyder的代码运行产生了一些嫌弃,每次按ctrl+enter都是运行全部,查了一下像Rstudio那样逐行运行是要按F9,太远了,不干。
于是想办法修改了一下
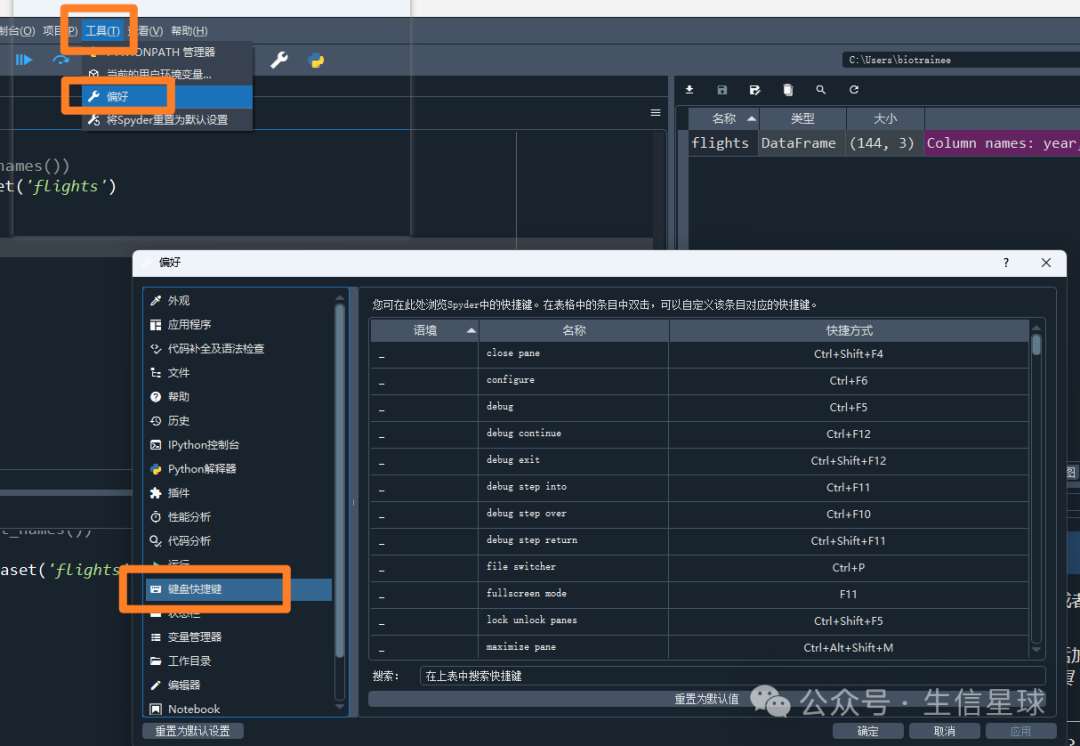
先找到原本的ctrl+回车快捷键,清除,然后找到F9,改成ctrl+回车。
2.示例数据
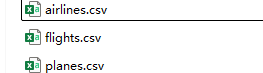
seaborn中有一个flights,但只有3列,不是练习中用的数据。从github搜索到了这个文件,并顺便在这个页面拿了另外两个csv,planes.csv后面也有用到,airlines.csv没用到,凑数的。
https://github.com/machow/nycflights13-py/blob/master/nycflights13/data/planes.csv
3.练习:读取多个csv文件
glob 函数返回与指定模式匹配的文件名列表。然后,可以用列表推导式将多个文件读入到列表中,按需提取感兴趣的 DataFrame。
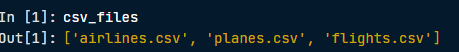
1.获取当前目录中所有 csv 文件的列表,赋值给 csv_files。
2.写一个列表推导式,将所有 csv 文件读入,成为一个列表,赋值给dfs。
3.写一个列表推导式,查看列表中每个 DataFrame 的 .shape。
import glob
import pandas as pd

# Get a list of all the csv files
csv_files = glob.____('*.csv')

# List comprehension that loads of all the files
dfs = [pd.read_csv(____) for ____ in ____]

# List comprehension that looks at the shape of all DataFrames
print(____)
答案
import glob
import pandas as pd

# Get a list of all the csv files
csv_files = glob.glob('*.csv')
csv_files
## ['airlines.csv', 'flights.csv', 'planes.csv']

# List comprehension that loads of all the files
dfs = [pd.read_csv(x) for x in csv_files]

# List comprehension that looks at the shape of all DataFrames
print([x.shape for x in dfs])
## [(16, 2), (336776, 20), (3322, 9)]
4.练习:探索数据
1.从dfs中提取出planes数据框,赋值给planes。
2.输出planes的engines的频数
3.对数据框进行取子集,查看所有engines>=3的行
4.对数据框进行取子集,以查看 engines>= 3 且seats<= 100 的所有行
# Get the planes DataFrame
planes = dfs[____]
# Count the frequency of engines in our data
print(____)
# Look at all planes with >= 3 engines
print(____[____])
# Look at all planes with >= 3 engines and <= 100 seats
print(____[____])
答案
# Get the planes DataFrame
planes = dfs[2]

# Count the frequency of engines in our data
print(planes['engines'].value_counts())

# Look at all planes with >= 3 engines
print(planes.loc[planes['engines'] >= 3])

# Look at all planes with >= 3 engines and <= 100 seats
print(planes.loc[(planes.engines >=3) & (planes.seats <=100)])
5.练习:可视化
1.用pandas画散点图,横坐标是engines,纵坐标是seats
2.用pandas画'seats'列的直方图
3.用 pandas画箱线图,横坐标是engines,纵坐标是seats
import matplotlib.pyplot as plt

# Scatter plot of engines and seats
planes.____(x=____, y=____, kind=____)
plt.show()

# Histogram of seats
____(kind=____)
plt.show()

# Boxplot of seats by engine
____(column=____, by=____)
plt.xticks(rotation=45)
plt.show()
答案
import matplotlib.pyplot as plt

# Scatter plot of engines and seats
planes.plot(x='engines', y='seats', kind='scatter')
plt.show()

# Histogram of seats
planes.seats.plot(kind='hist')
plt.show()

# Boxplot of seats by engine
planes.boxplot(column='seats', by='engine')
plt.xticks(rotation=45)
plt.show()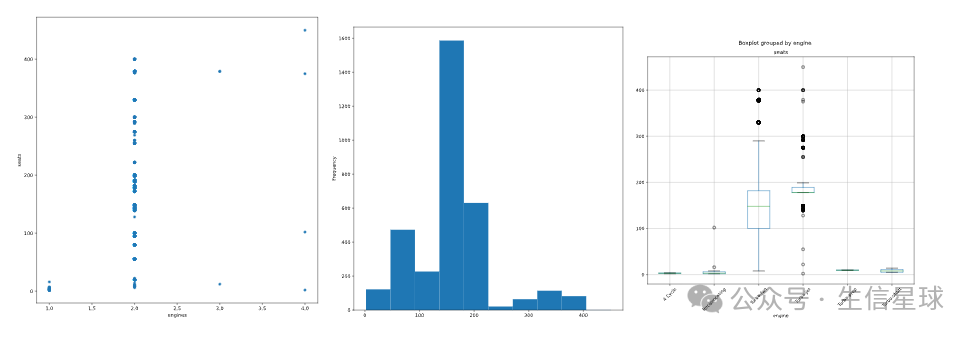
6.练习:Groupby 和 aggregates
这里用到了一个不重要的知识点,时间转换为季节。课程用到了一个没有提供的自定义函数来完成这个操作,为了后面代码顺利运行,我把这个代码补上去了。感谢chatgpt
from datetime import datetime

def get_season(date_str):
    # 定义每个季节的开始和结束日期
    spring_start = datetime.strptime("2013-03-20", "%Y-%m-%d")
    summer_start = datetime.strptime("2013-06-21", "%Y-%m-%d")
    fall_start = datetime.strptime("2013-09-22", "%Y-%m-%d")
    winter_start = datetime.strptime("2013-12-21", "%Y-%m-%d")

    # 解析输入日期
    date = datetime.strptime(date_str, "%Y-%m-%d %H:%M:%S")

    # 考虑年份变化
    year = date.year
    if date < spring_start.replace(year=year):
        return "Winter"
    elif date < summer_start.replace(year=year):
        return "Spring"
    elif date < fall_start.replace(year=year):
        return "Summer"
    elif date < winter_start.replace(year=year):
        return "Fall"
    else:
        return "Winter"

# 测试函数
test_date = "2013-01-01 05:00:00"
print(get_season(test_date))  # 输出:Winter

test_date = "2013-04-01 05:00:00"
print(get_season(test_date))  # 输出:Spring

test_date = "2013-07-01 05:00:00"
print(get_season(test_date))  # 输出:Summer

test_date = "2013-10-01 05:00:00"
print(get_season(test_date))  # 输出:Fall

test_date = "2013-12-25 05:00:00"
print(get_season(test_date))  # 输出:Winter

# 根据time_hour列来推断季节,并添加到flights里
flights = dfs[1]
flights['season'] = [get_season(x) for x in flights['time_hour']]
flights['season'].value_counts()

## season
## Summer    87341
## Spring    87089
## Fall      83190
## Winter    79156
## Name: count, dtype: int64
groupby可以分组计算多个变量的某一统计量
aggregates可以分组计算多个变量计算多个统计量
1.添加total_delay列,内容是把dep_delay列和arr_delay列相加
2.计算每个航班的total_delay均值并重置索引。
3.计算每个季节的出发和到达延误的平均值,并重置索引。
4.计算每个始发地的出发、到达和总延误的平均值和标准差。
# Calculate total_delay
flights['total_delay'] = ____ + ____

# Mean total_delay by carrier
tdel_car = ____.____(____)[____].____().reset_index()
print(tdel_car)

# Mean dep_delay and arr_delay for each season
dadel_season = ____.____(____)[____, ____].____().reset_index()
print(dadel_season)

# Mean and std delays by origin
del_ori = flights.groupby('origin')['total_delay', 'dep_delay', 'arr_delay'].____([____, 'std'])
print(del_ori)
按照上面的写法,groupby后面选要计算的列时如果使用了一个中括号,会遇到报错:
ValueError: Cannot subset columns with a tuple with more than one element. Use a list instead.
解决办法是把列名变成列表,也就是使用两个中括号。
https://wenku.csdn.net/answer/ae36c7adc06c404aba632d1e9fa6561c
# Calculate total_delay
flights['total_delay'] = flights['dep_delay'] + flights['arr_delay']

# Mean total_delay by carrier
tdel_car = flights.groupby('carrier')['total_delay'].mean().reset_index()
print(tdel_car)

# Mean dep_delay and arr_delay for each season
dadel_season = flights.groupby('season')[['dep_delay', 'arr_delay']].mean().reset_index()
print(dadel_season)

# Mean and std delays by origin
del_ori = flights.groupby('origin')[['total_delay', 'dep_delay', 'arr_delay']].agg(['mean', 'std'])
print(del_ori)
我的关注点是:
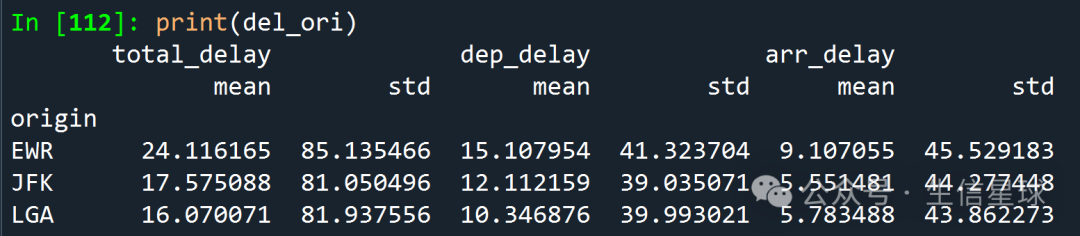
数据框的列名居然可以有两行啊。
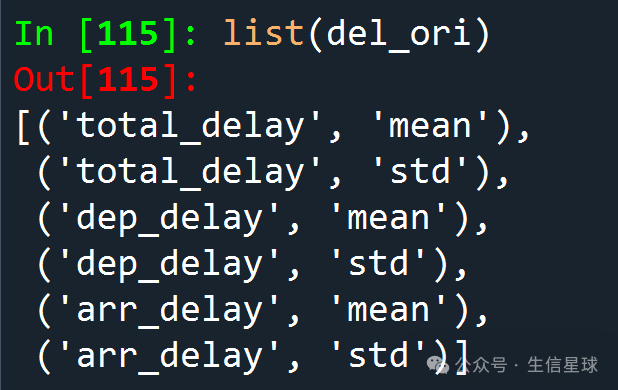
如果单独查看列名的话:
7.拼图
1.创建一个两行一列的figure
2.使用seaborn,以flights数据的orgigin和dep_delay列作为横纵坐标画箱线图
3.使用seaborn,以tedel_car数据的carrier和carrier列作为横纵坐标画条形图
4.设置标题:'Originating airport and the departure delay'.
# Create a figure
fig, (ax1, ax2) = plt.subplots(____)

# Boxplot and barplot in the axes
sns.____(x=____, y=____, data=flights, ax=____)
sns.____(x=____, y=____, data=tdel_car, ax=____)

# Label axes
ax1.set_title(____)

# Use tight_layout() so the plots don't overlap
fig.tight_layout()
plt.show()
答案
# Create a figure
fig, (ax1, ax2) = plt.subplots(2,1)

# Boxplot and barplot in the axes
sns.boxplot(x='origin', y='dep_delay', data=flights, ax=ax1)
sns.barplot(x='carrier', y='total_delay', data=tdel_car, ax=ax2)

# Label axes
ax1.set_title('Originating airport and the departure delay')

# Use tight_layout() so the plots don't overlap
fig.tight_layout()
plt.show()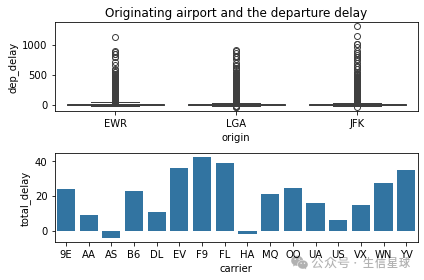
8.虚拟变量
虚拟变量是对非数值列进行虚拟编码(转换为整数)来准备机器学习建模的数据,也称为独热编码(one-hot encoding)
虚拟变量的用途:
- 处理分类变量:
在机器学习模型中,许多算法要求输入特征是数值型的。通过将分类变量转换为虚拟变量,可以使这些变量适合用于算法。
- 防止虚拟变量陷阱:
使用虚拟变量时,如果有n个类别,通常会创建n-1个虚拟变量,以避免多重共线性(即自变量之间的高度相关性),这被称为虚拟变量陷阱。
- 提高模型的可解释性:
虚拟变量使得模型能够更清晰地理解不同类别对结果变量的影响,可帮助分析每个类别的贡献。
- 增强模型的表现:
将分类特征转换为虚拟变量后,可以提高某些机器学习模型的预测准确性,因为模型可以捕捉到类别间的差异。
flights_sub是flights数据的子集。
flights_sub = flights[['year', 'month', 'day', 'dep_time', 'dep_delay', 'origin']]1.输出flights_sub的前五行
2.flights_sub执行one-hot encoding,把origin列转换为数值
3.输出flights_dummies的前五行
# Look at the head of flights_sub
print(____)
# Create dummy variables
flights_dummies = ____
# Look at the head of flights_dummies
print(____)
答案
# Look at the head of flights_sub
print(flights_sub.head())

## year  month  day  dep_time  dep_delay origin
## 0  2013      1    1     517.0        2.0    EWR
## 1  2013      1    1     533.0        4.0    LGA
## 2  2013      1    1     542.0        2.0    JFK
## 3  2013      1    1     544.0       -1.0    JFK
## 4  2013      1    1     554.0       -6.0    LGA

# Create dummy variables
flights_dummies = pd.get_dummies(flights_sub)

# Look at the head of flights_dummies
print(flights_dummies.head())

## year  month  day  dep_time  dep_delay  origin_EWR  origin_JFK  origin_LGA
## 0  2013      1    1     517.0        2.0        True       False       False
## 1  2013      1    1     533.0        4.0       False       False        True
## 2  2013      1    1     542.0        2.0       False        True       False
## 3  2013      1    1     544.0       -1.0       False        True       False
## 4  2013      1    1     554.0       -6.0       False       False        True
我发现课程的网页运行环境里origin已经被变成了0和1,而我的运行结果是逻辑值。
数据类型没有区别,都是字符型,估计又是因为函数版本的差别。搜索发现可以加个参数指定为整数型。
flights_dummies = pd.get_dummies(flights_sub, dtype=int)

# Look at the head of flights_dummies
print(flights_dummies.head())
##  year  month  day  dep_time  dep_delay  origin_EWR  origin_JFK  origin_LGA
## 0  2013      1    1     517.0        2.0           1           0           0
## 1  2013      1    1     533.0        4.0           0           0           1
## 2  2013      1    1     542.0        2.0           0           1           0
## 3  2013      1    1     544.0       -1.0           0           1           0
## 4 2013 1 1 554.0 -6.0 0 0 1腾讯云开发者
