🤩 Seurat | 空间转录组数据分析的标准流程!~(四)(Visium HD全流程)
🤩 Seurat | 空间转录组数据分析的标准流程!~(四)(Visium HD全流程)
生信漫卷
发布于 2025-11-13 18:26:45
发布于 2025-11-13 18:26:45
写在前面
用Seurat按Visium HD官方流程,完成从多分辨率 bin(8/16 μm)加载 → 归一化 → 下采样 sketch → 全量投影 → 空间聚类(BANKSY) → 标注与可视化。🧐
为什么是 Visium HD? 分辨率更高(μm 级),允许我们在同一个对象里切换 8/16 μm 两种空间尺度做对比,更贴近“结构域”的真实尺度。🤓
最容易踩的坑(务必看一眼):👇
tar.gz一定要先解压;本例只需 Binned outputs + Spatial outputs 两个压缩包;Load10X_Spatial() 的data.dir要指向解压后的目录,且包含feature_matrix.h5;Visium HD无filtered_feature_bc_matrix.h5;- 多分辨率 assay 名字如 "Spatial.008um" / "Spatial.016um",切换
DefaultAssay再作图,否则会“跨尺度拿错数据”; - 大数据对象下 future.globals.maxSize 超限/LeverageScore 过慢:优先用 method="Uniform"的sketch;
- SpatialDimPlot(label=TRUE, repel=TRUE) 报最近邻错误:多因坐标含
NA/NaN/Inf或分组为NA,先剔除再作图。
用到的包
rm(list = ls())
library(Seurat)
library(ggplot2)
library(patchwork)
library(dplyr)
示例数据
这里我们使用的小鼠大脑的 Visium HD 数据集。🤓
只解压并使用 Binned outputs(有 feature_matrix.h5)与 Spatial outputs(图像与坐标)。😛
其它如 .cloupe、Molecule info H5 非 Seurat 必需。🫠
untar("./visium_hd/mouse_brain/Visium_HD_Mouse_Brain_binned_outputs.tar.gz",exdir = "./visium_hd/mouse_brain/")
untar("./visium_hd/mouse_brain/Visium_HD_Mouse_Brain_spatial.tar.gz", exdir = "./visium_hd/mouse_brain/")
Visium HD 支持多个 bin 分辨率并存。
作图或分析前务必确认DefaultAssay,否则容易“跨分辨率错读”。😂
localdir <- "./visium_hd/mouse_brain/"
object <- Load10X_Spatial(data.dir = localdir, bin.size = c(8, 16))

# Setting default assay changes between 8um and 16um binning
Assays(object)
DefaultAssay(object) <- "Spatial.008um"
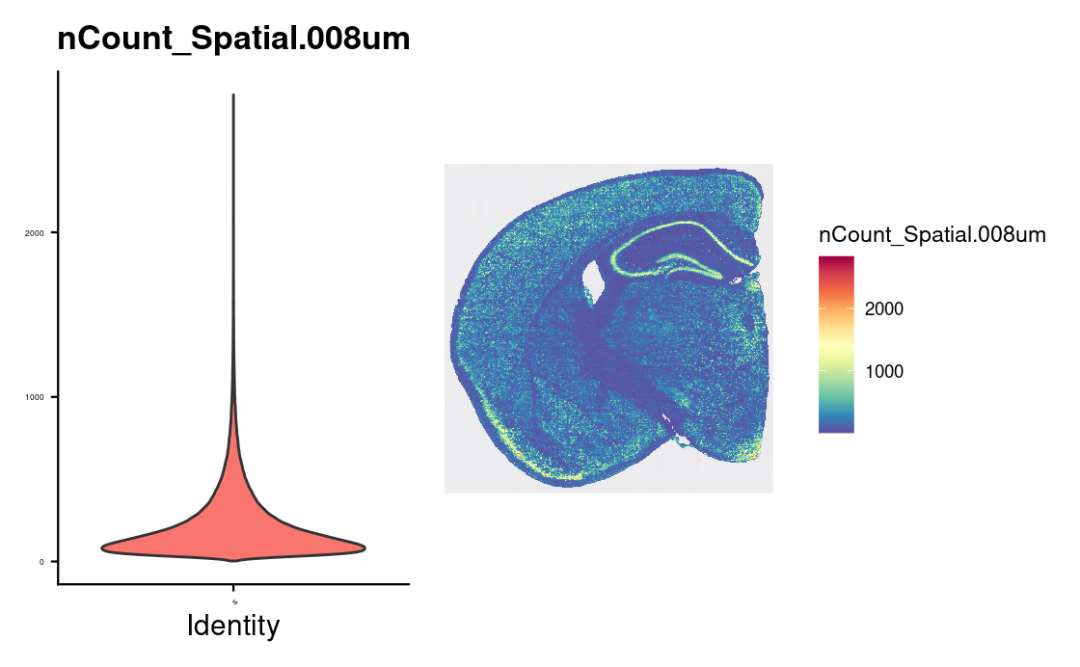
计数与空间图!~🫢
vln.plot <- VlnPlot(object, features = "nCount_Spatial.008um", pt.size = 0) + theme(axis.text = element_text(size = 4)) + NoLegend()
count.plot <- SpatialFeaturePlot(object, features = "nCount_Spatial.008um") + theme(legend.position = "right")

# note that many spots have very few counts, in-part
# due to low cellular density in certain tissue regions
vln.plot | count.plot
NormalizeData
我们对空间数据使用标准的对数归一化。😅
若要更强鲁棒性可用SCT,但对内存更敏感;教学示例先用LogNormalize。😂
空间数据的最佳归一化方法目前还没有定论。🙊
# normalize both 8um and 16um bins
DefaultAssay(object) <- "Spatial.008um"
object <- NormalizeData(object)

DefaultAssay(object) <- "Spatial.016um"
object <- NormalizeData(object)
基因表达可视化
初步看一下可视化的样子吧!~🥰
16 μm 更平滑、噪声更小;🙊
8 μm 更精细但更稀疏。🥳
实际项目中可先在 16 μm 找大体结构,再回到 8 μm 精修。😀
# switch spatial resolution to 16um from 8um
DefaultAssay(object) <- "Spatial.016um"
p1 <- SpatialFeaturePlot(object, features = "Rorb") + ggtitle("Rorb expression (16um)")

# switch back to 8um
DefaultAssay(object) <- "Spatial.008um"
p2 <- SpatialFeaturePlot(object, features = "Hpca") + ggtitle("Hpca expression (8um)")

p1 | p2

无监督聚类
为什么要Sketch下采样?👇
全量μm级数据很大,直接PCA/邻居图会慢。🫠
先抽样(这里是5000)建模,再把结果投影回全量,效率与效果两全。🫢
并且Sketch有利于保留稀有细胞亚群。😀
# note that data is already normalized
DefaultAssay(object) <- "Spatial.008um"
object <- FindVariableFeatures(object)
object <- ScaleData(object)

# we select 5,000 cells and create a new 'sketch' assay
object <- SketchData(
  object = object,
  ncells = 5000,
  method = "Uniform",
  sketched.assay = "sketch"
)

# switch analysis to sketched cells
DefaultAssay(object) <- "sketch"

# perform clustering workflow
object <- FindVariableFeatures(object)
object <- ScaleData(object)
object <- RunPCA(object, assay = "sketch", reduction.name = "pca.sketch")
object <- FindNeighbors(object, assay = "sketch", reduction = "pca.sketch", dims = 1:50)
object <- FindClusters(object, cluster.name = "seurat_cluster.sketched", resolution = 3)
object <- RunUMAP(object, reduction = "pca.sketch", reduction.name = "umap.sketch", return.model = T, dims = 1:50)

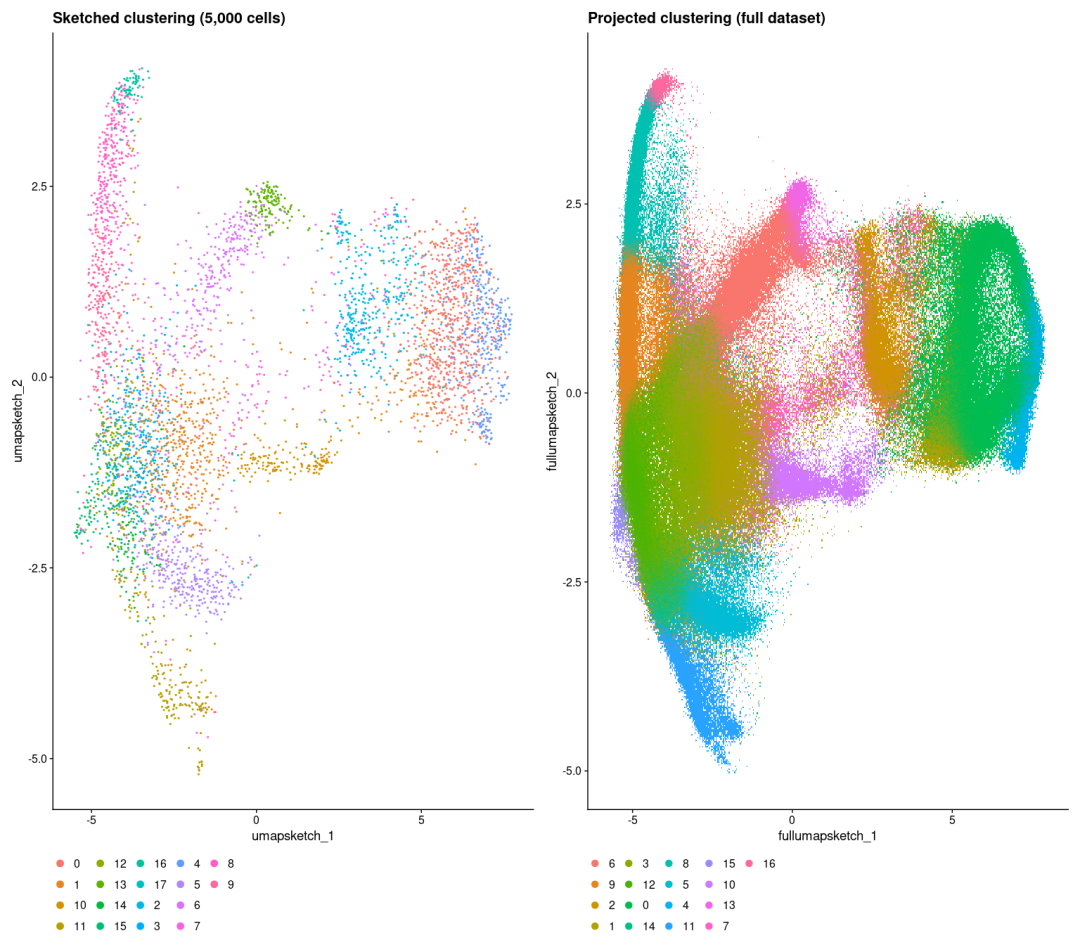
现在,我们可以使用ProjectData函数将从5,000个Sketch中学到的聚类标签和降维(PCA 和 UMAP)投影到整个数据集。🫢
object <- ProjectData(
  object = object,
  assay = "Spatial.008um",
  full.reduction = "full.pca.sketch",
  sketched.assay = "sketch",
  sketched.reduction = "pca.sketch",
  umap.model = "umap.sketch",
  dims = 1:50,
  refdata = list(seurat_cluster.projected = "seurat_cluster.sketched")
)

现在我们看一下Sketch的聚类结果,以及完整数据集的投影聚类结果。🥳
DefaultAssay(object) <- "sketch"
Idents(object) <- "seurat_cluster.sketched"
p1 <- DimPlot(object, reduction = "umap.sketch", label = F) + ggtitle("Sketched clustering (5,000 cells)") + theme(legend.position = "bottom")

# switch to full dataset
DefaultAssay(object) <- "Spatial.008um"
Idents(object) <- "seurat_cluster.projected"
p2 <- DimPlot(object, reduction = "full.umap.sketch", label = F) + ggtitle("Projected clustering (full dataset)") + theme(legend.position = "bottom")

p1 | p2
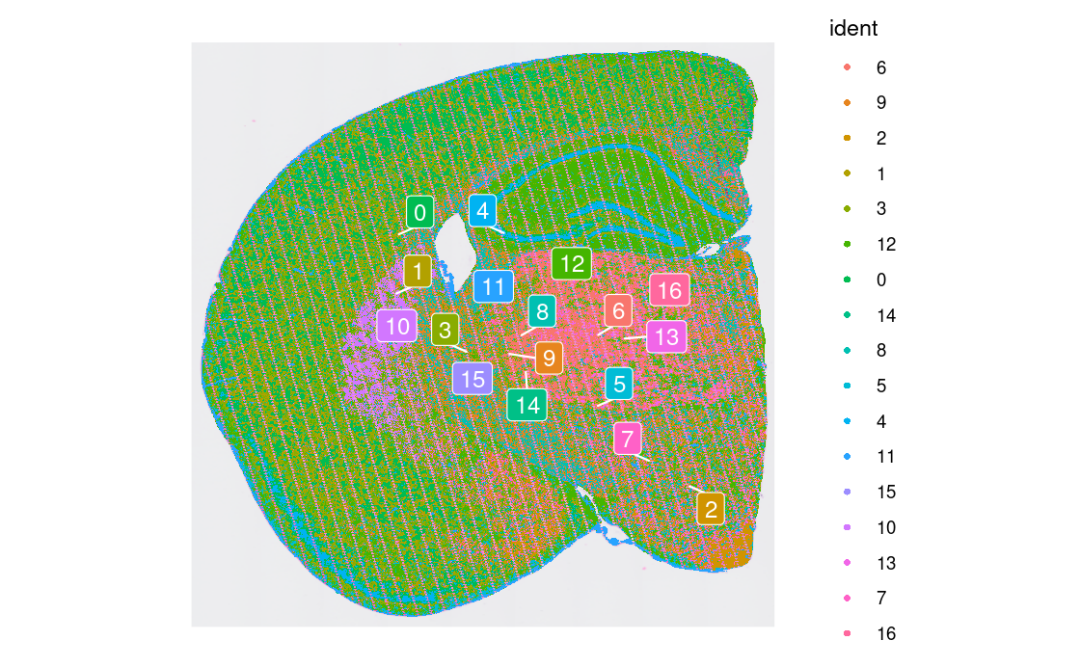
我们现在也可以根据无监督聚类的空间位置来可视化。🥳
SpatialDimPlot(object, label = T, repel = T, label.size = 4)
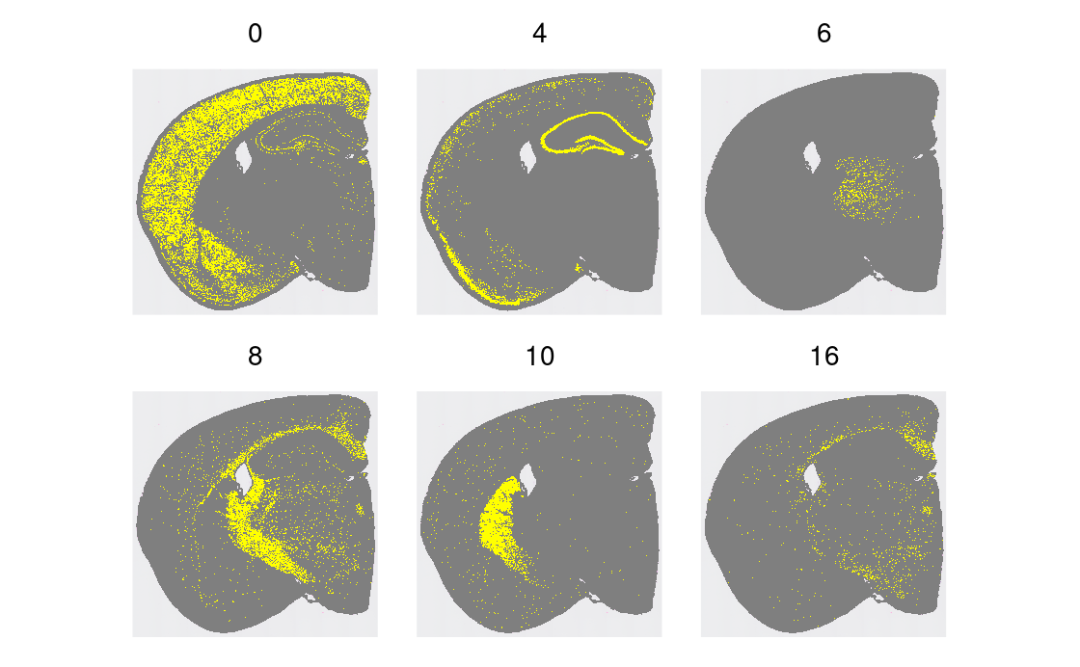
结构域高亮(挑几个类)!~😀
Idents(object) <- "seurat_cluster.projected"
cells <- CellsByIdentities(object, idents = c(0, 4, 6, 8, 10, 16))
p <- SpatialDimPlot(object,
  cells.highlight = cells[setdiff(names(cells), "NA")],
  cols.highlight = c("#FFFF00", "grey50"), facet.highlight = T, combine = T
) + NoLegend()
p
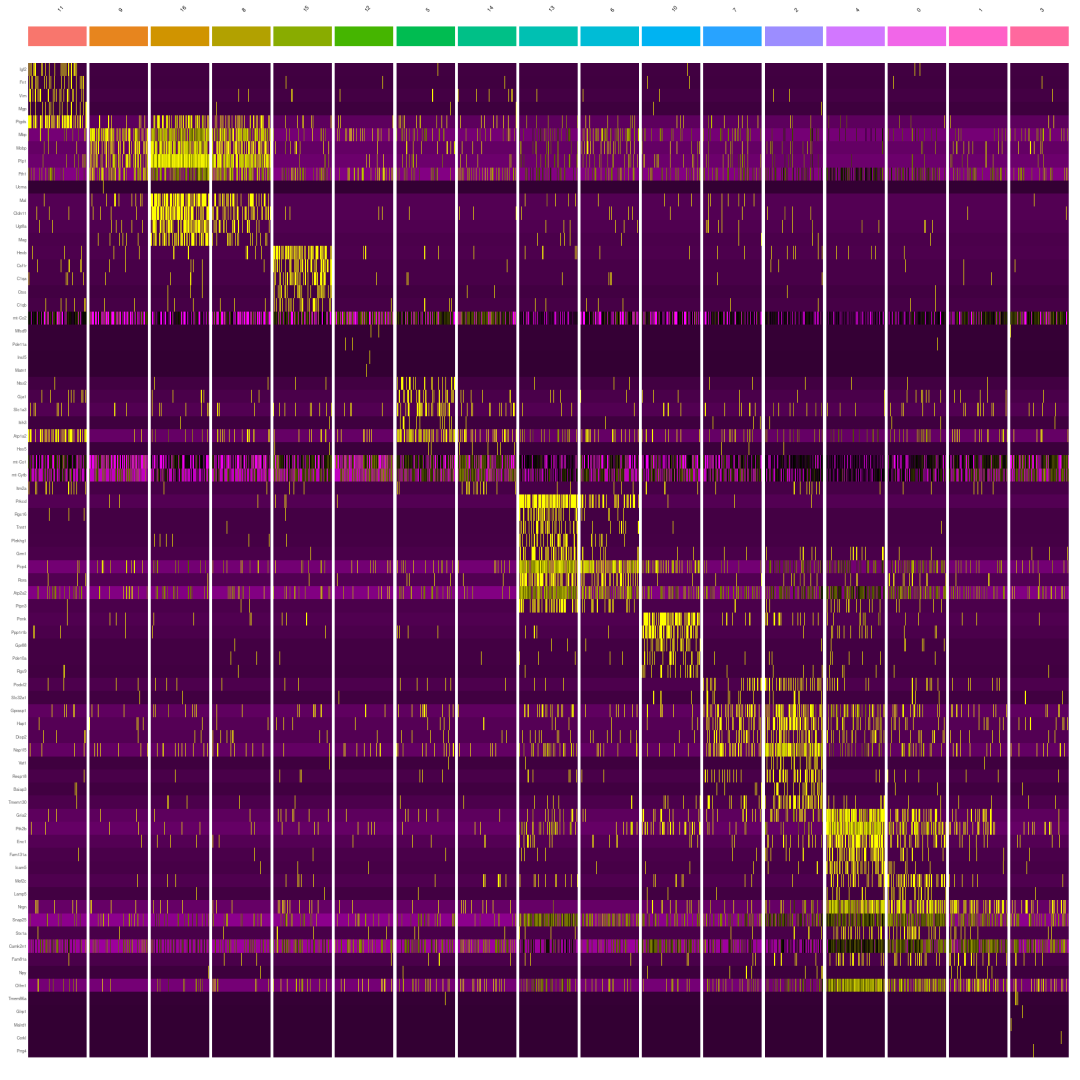
标记基因的热图。😍
# Crete downsampled object to make visualization either
DefaultAssay(object) <- "Spatial.008um"
Idents(object) <- "seurat_cluster.projected"
object_subset <- subset(object, cells = Cells(object[["Spatial.008um"]]), downsample = 100)

# Order clusters by similarity
DefaultAssay(object_subset) <- "Spatial.008um"
Idents(object_subset) <- "seurat_cluster.projected"
object_subset <- BuildClusterTree(object_subset, assay = "Spatial.008um", reduction = "full.pca.sketch", reorder = T)

markers <- FindAllMarkers(object_subset, assay = "Spatial.008um", only.pos = TRUE)
markers %>%
  group_by(cluster) %>%
  dplyr::filter(avg_log2FC > 1) %>%
  slice_head(n = 5) %>%
  ungroup() -> top5

object_subset <- ScaleData(object_subset, assay = "Spatial.008um", features = top5$gene)
p <- DoHeatmap(object_subset, assay = "Spatial.008um", features = top5$gene, size = 2.5) + theme(axis.text = element_text(size = 5.5)) + NoLegend()
p
识别空间定义的组织结构域(BANKSY)
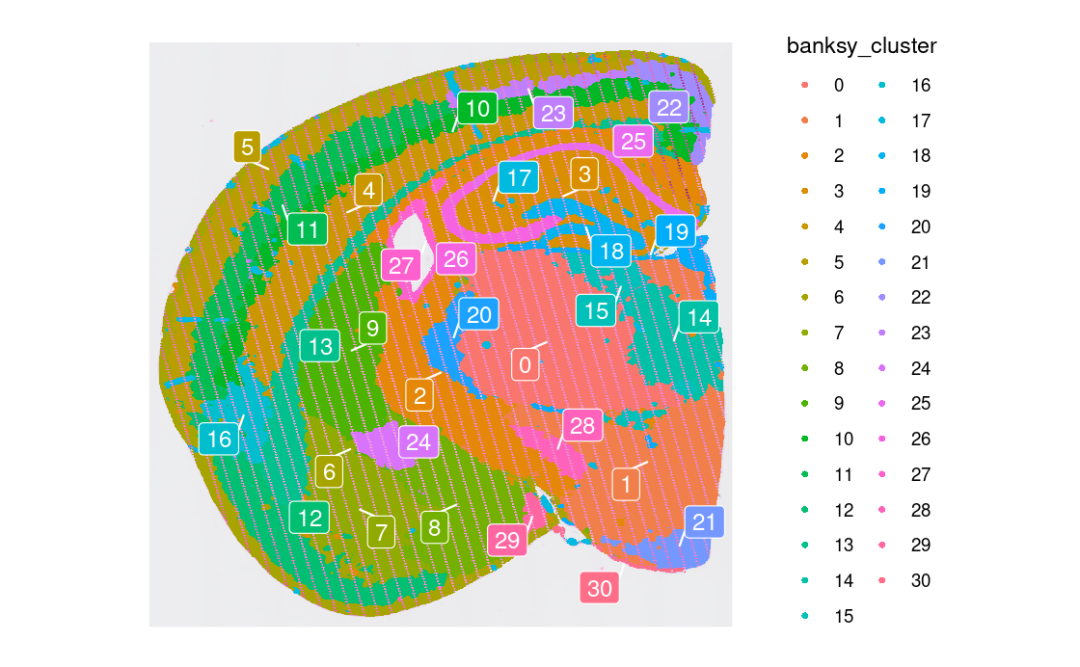
BANKSY将表达与邻域信息整合,分割出“空间结构域”,对HD非常契合。🥸
if (!requireNamespace("Banksy", quietly = TRUE)) {
  remotes::install_github("prabhakarlab/Banksy@devel")
}
library(SeuratWrappers)
library(Banksy)
1️⃣ k_geom :值越大,域越大;
2️⃣ lambda :值越大,产生空间相干的域越强。
object <- RunBanksy(object,
  lambda = 0.8, verbose = TRUE,
  assay = "Spatial.008um", slot = "data", features = "variable",
  k_geom = 50
)

DefaultAssay(object) <- "BANKSY"
object <- RunPCA(object, assay = "BANKSY", reduction.name = "pca.banksy", features = rownames(object), npcs = 30)
object <- FindNeighbors(object, reduction = "pca.banksy", dims = 1:30)
object <- FindClusters(object, cluster.name = "banksy_cluster", resolution = 0.5)
Idents(object) <- "banksy_cluster"

p <- SpatialDimPlot(object, group.by = "banksy_cluster",
                    images="slice1.008um",
                    label = T, repel = T, label.size = 4)
p
与无监督聚类一样,我们可以单独突出显示每个组织域的空间位置:👇
banksy_cells <- CellsByIdentities(object)
p <- SpatialDimPlot(object, cells.highlight = banksy_cells[setdiff(names(banksy_cells), "NA")],
                    cols.highlight = c("#FFFF00", "grey50"), facet.highlight = T, combine = T) +
      NoLegend()
p

本文参与 腾讯云自媒体同步曝光计划,分享自微信公众号。
原始发表:2025-10-02,如有侵权请联系 cloudcommunity@tencent.com 删除
评论
登录后参与评论
推荐阅读
目录

