Python Matplotlib在图形上悬停时显示光标
我想在下面标出INS的收盘价,这样就可以了。然后,我想在图形上悬停时添加光标。我遵循https://matplotlib.org/3.1.0/gallery/misc/cursor_demo_sgskip.html的演示,这就是我想要的。
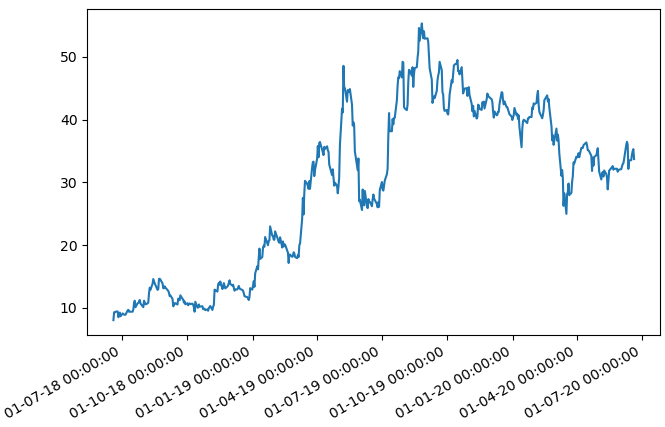
但是,当我将这些行添加到代码中时,它会显示值错误。一开始,我使用时代时间作为x轴,我认为这就是问题所在,所以我把划时代时间转换成日期时间,但它仍然不起作用,什么也没有画出来。
snap_cursor = SnaptoCursor(ax, secs, df['close'])
fig.canvas.mpl_connect('motion_notify_event', snap_cursor.mouse_move)
"c:\Users\Sam.vscode\extensions\ms-python.python-2020.6.89148\pythonFiles\ptvsd_launcher.py",跟踪(最近一次调用):
第48行,主(PtvsdArgs)文件第432行,在main run() File "c:\Users\Sam.vscode\extensions\ms-python.python-2020.6.89148\pythonFiles\lib\python\old_ptvsd\ptvsd_main_.py",第316行中,在run_file runpy.run_path中(run_file,run_name='main') "C:\Users\Sam\AppData\Local\Programs\Python\Python36\lib\runpy.py",第263行),在run_path pkg_name=pkg_name中,文件"C:\Users\Sam\AppData\Local\Programs\Python\Python36\lib\runpy.py",( script_name=fname)第96行,在_run_module_code mod_name、mod_spec、pkg_name、script_name)第85行中,在_run_code exec(代码,run_globals)文件"c:\Users\Sam\OneDrive\Project\stock\test.py",第89行中,在plt.gcf().autofmt_xdate() .autofmt_xdate第632行中,在autofmt_xdate中self.axes.get_xticklabels(which=which)中:文件.autofmt_xdate第3355行,在get_xticklabels返回self.xaxis.get_ticklabels(minor=minor )中,文件"C:\Users\Sam\AppData\Local\Programs\Python\Python36\lib\site-packages\matplotlib\axis.py",第1320行,在get_ticklabels返回self.get_majorticklabels()文件第1276行,在get_majorticklabels文件"C:\Users\Sam\AppData\Local\Programs\Python\Python36\lib\site-packages\matplotlib\axis.py",第1431行,在"C:\Users\Sam\AppData\Local\Programs\Python\Python36\lib\site-packages\matplotlib\axis.py",的get_major_ticks numticks = len(self.get_majorticklocs()) get_major_ticks第1348行中,在get_majorticklocs返回self.major.locator()文件的第1338行中,在"C:\Users\Sam\AppData\Local\Programs\Python\Python36\lib\site-packages\matplotlib\dates.py",call self.refresh() self.refresh第1364行中,在刷新dmin中,dmax = self.viewlim_to_dt()文件"C:\Users\Sam\AppData\Local\Programs\Python\Python36\lib\site-packages\matplotlib\dates.py",行1098,在viewlim_to_dt .format(Vmin) ValueError:视图限制最小值-36879.777083333334小于1,并且是无效的Matplotlib日期值。如果将非datetime值传递给具有日期时间单位的轴,则通常会发生这种情况。
class SnaptoCursor(object):
    """
    Like Cursor but the crosshair snaps to the nearest x, y point.
    For simplicity, this assumes that *x* is sorted.
    """

    def __init__(self, ax, x, y):
        self.ax = ax
        self.lx = ax.axhline(color='k')  # the horiz line
        self.ly = ax.axvline(color='k')  # the vert line
        self.x = x
        self.y = y
        # text location in axes coords
        self.txt = ax.text(0.7, 0.9, '', transform=ax.transAxes)

    def mouse_move(self, event):
        if not event.inaxes:
            return

        x, y = event.xdata, event.ydata
        indx = min(np.searchsorted(self.x, x), len(self.x) - 1)
        x = self.x[indx]
        y = self.y[indx]
        # update the line positions
        self.lx.set_ydata(y)
        self.ly.set_xdata(x)

        self.txt.set_text('x=%1.2f, y=%1.2f' % (x, y))
        print('x=%1.2f, y=%1.2f' % (x, y))
        self.ax.figure.canvas.draw()

data = td.pricehistory("INS")
df = pd.DataFrame(data['candles'])
df['datetime'] = df.apply(lambda x: datetime.datetime.fromtimestamp(x['datetime']/1000),axis=1)
secs = df['datetime']
fig, ax = plt.subplots(1, 1)
ax.plot(secs,df['close'])

snap_cursor = SnaptoCursor(ax, secs, df['close'])
fig.canvas.mpl_connect('motion_notify_event', snap_cursor.mouse_move)

plt.gcf().autofmt_xdate()
myFmt = mdates.DateFormatter('%d-%m-%y %H:%M:%S')
plt.gca().xaxis.set_major_formatter(myFmt)

plt.show()回答 1
Stack Overflow用户
发布于 2020-06-21 05:31:27
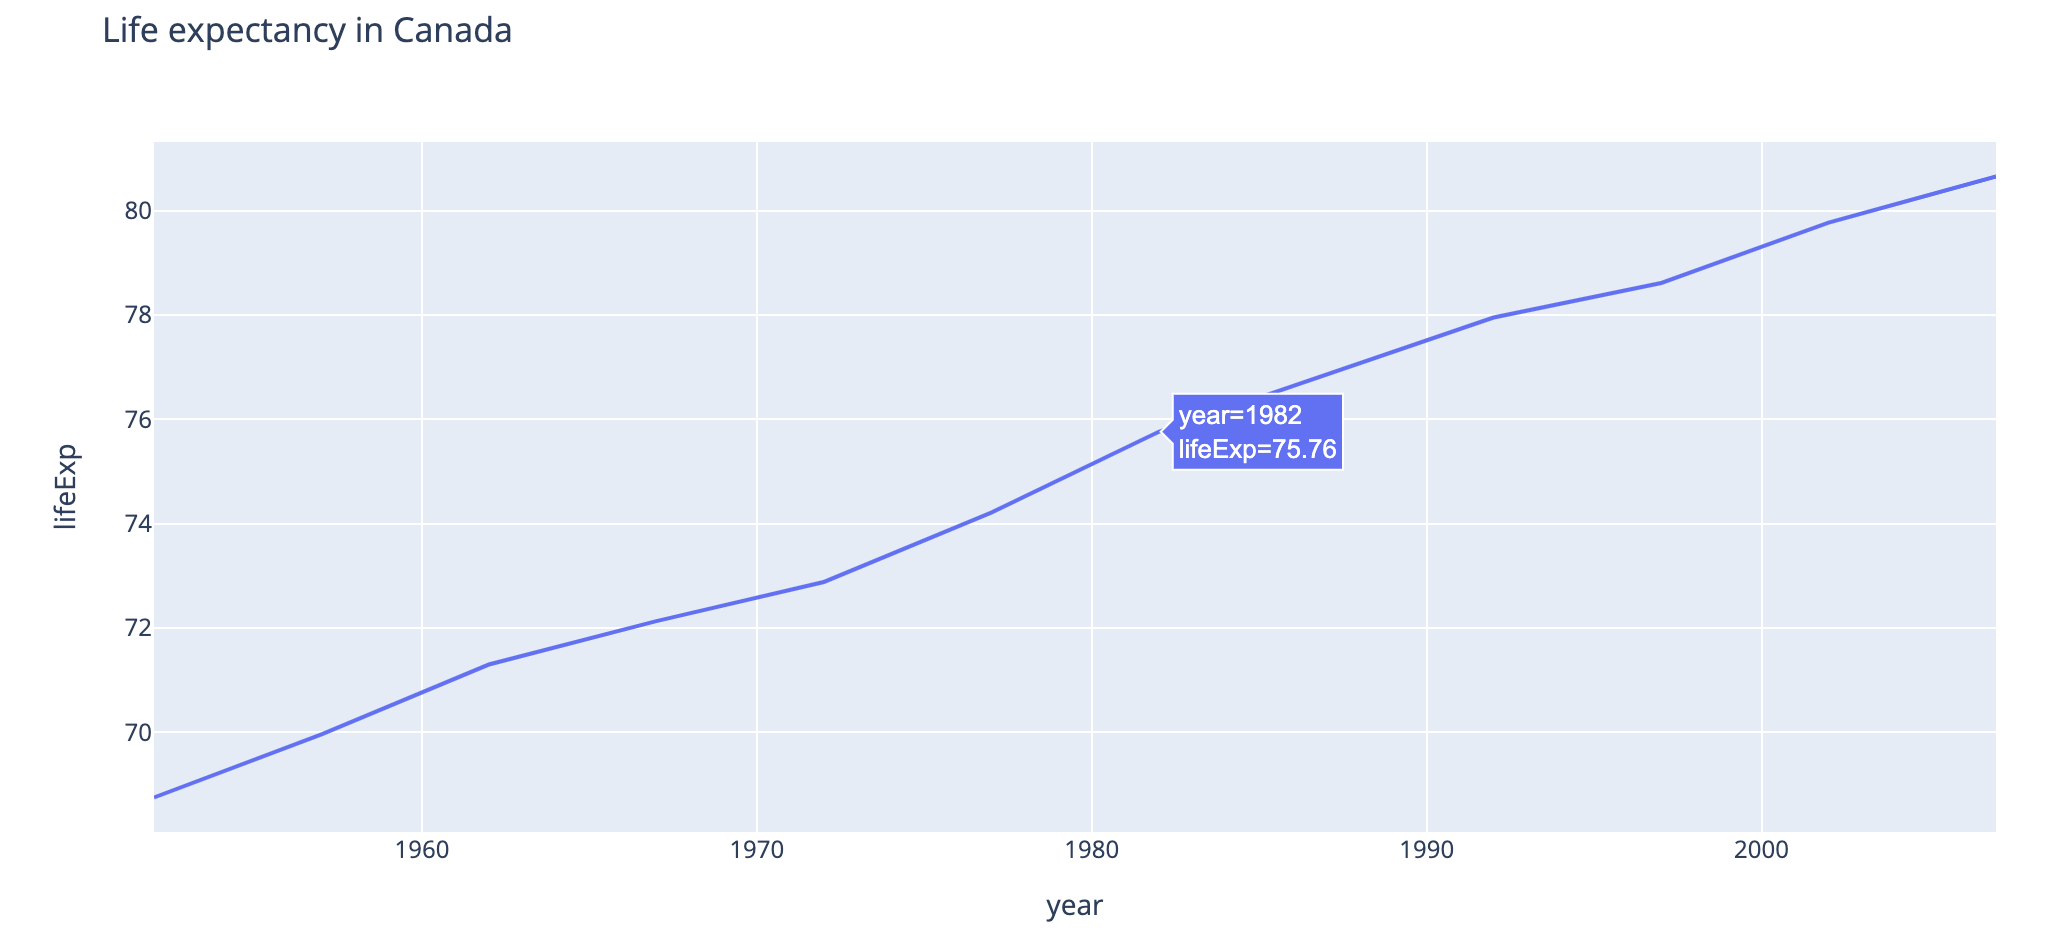
我对SnaptoCursor并不熟悉,但是你有没有考虑过用巧妙的方式来代替呢?
保存了许多代码行,并且非常方便用户:
# install plotly library
!pip install plotly

# import express module
import plotly.express as px

# plot interactive line chart
fig = px.line(data=df, x="datetime", y="close")
fig.show()它也很灵活。以下是文档:https://plotly.com/python/line-charts/
您也可以使用光标与绘图进行交互,例如:
希望这会有所帮助,当然,这和你想做的不一样!
https://stackoverflow.com/questions/62498931
复制


相似问题
在Python中鼠标光标悬停在某物上时显示消息
在matplotlib图像上悬停时显示工具提示
将光标放在图形上时显示图形的值
Python Matplotlib在保存图形/绘图时不显示图形面部颜色
悬停时在光标旁边显示图像
领取专属 10元无门槛券
AI混元助手 在线答疑

洞察 腾讯核心技术
剖析业界实践案例

腾讯云开发者
