再次,我有4个图的R,不同的x轴,但相似的趋势曲线。我试图覆盖它们,但它们没有对齐。
我被协助在这个链接我在R上有两个图,它们有不同的x轴,但趋势曲线相似。如何将它们叠加在r上?上覆盖两个不同x轴的图.然而,我现在正在尝试覆盖4图。我试图覆盖他们,但他们没有对齐。我需要帮助覆盖这四张图。
我的初步审判代码如下:
- 我的原始数据在下面的链接https://drive.google.com/drive/folders/1ZZQAATkbeV-Nvq1YYZMYdneZwMvKVUq1?usp=sharing中。
- 用于执行的代码: 第一,数据=第一,aes(x,y)) +geom_line(数据= 1)第二,数据=第二,aes(x,y)) +geom_line(数据= 1)第三<- g图(数据=第三,aes(x,y))+geom_line(数据=1,)+ geom_line(pch = 1)第四<- ggplot(数据=第四,aes(x,y)) + geom_line(pch = 1)第一个$匹配<- -第一个$x第二个$匹配<- -第二个$x-第二个$x$x$y == max(第二个$y)+第一个$xfirst$y == max(第一个$y)第三个$==max(第一个$y)第三个$x4$匹配<-第四个$x第一个$序列=“第二个”$系列=“第二个”$系列=“第三个”==系列=“第四个”all_data <- rbind(第一,第二,第一,第二,第三,第四,all_data+ geom_line(aes(x = match,y,color =element_blank))+scale_x_continuous(名称= "X,任意单位“)+主题(axis.text.x= element_blank())
会非常感谢你的帮助。
回答 1
Stack Overflow用户
发布于 2020-08-22 05:51:10
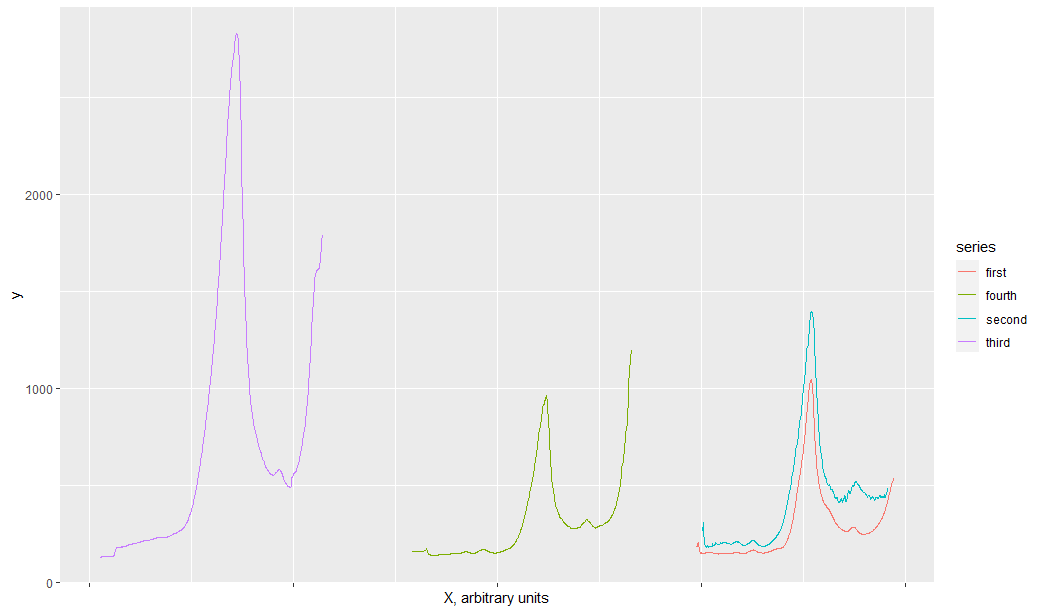
我想我会为你的问题提出一个解决方案。OP有4个带有x和y列的数据集,并且希望在每个数据集中对齐峰值,以便它们相互叠加在一起。下面是我们将所有数据集绘制在一起时的样子:
p <- ggplot(mapping=aes(x=x, y=y)) + theme_bw() +
  geom_line(data=first, aes(color="first")) +
  geom_line(data=second, aes(color="second")) +
  geom_line(data=third, aes(color="third")) +
  geom_line(data=fourth, aes(color="fourth"))
办法如下:
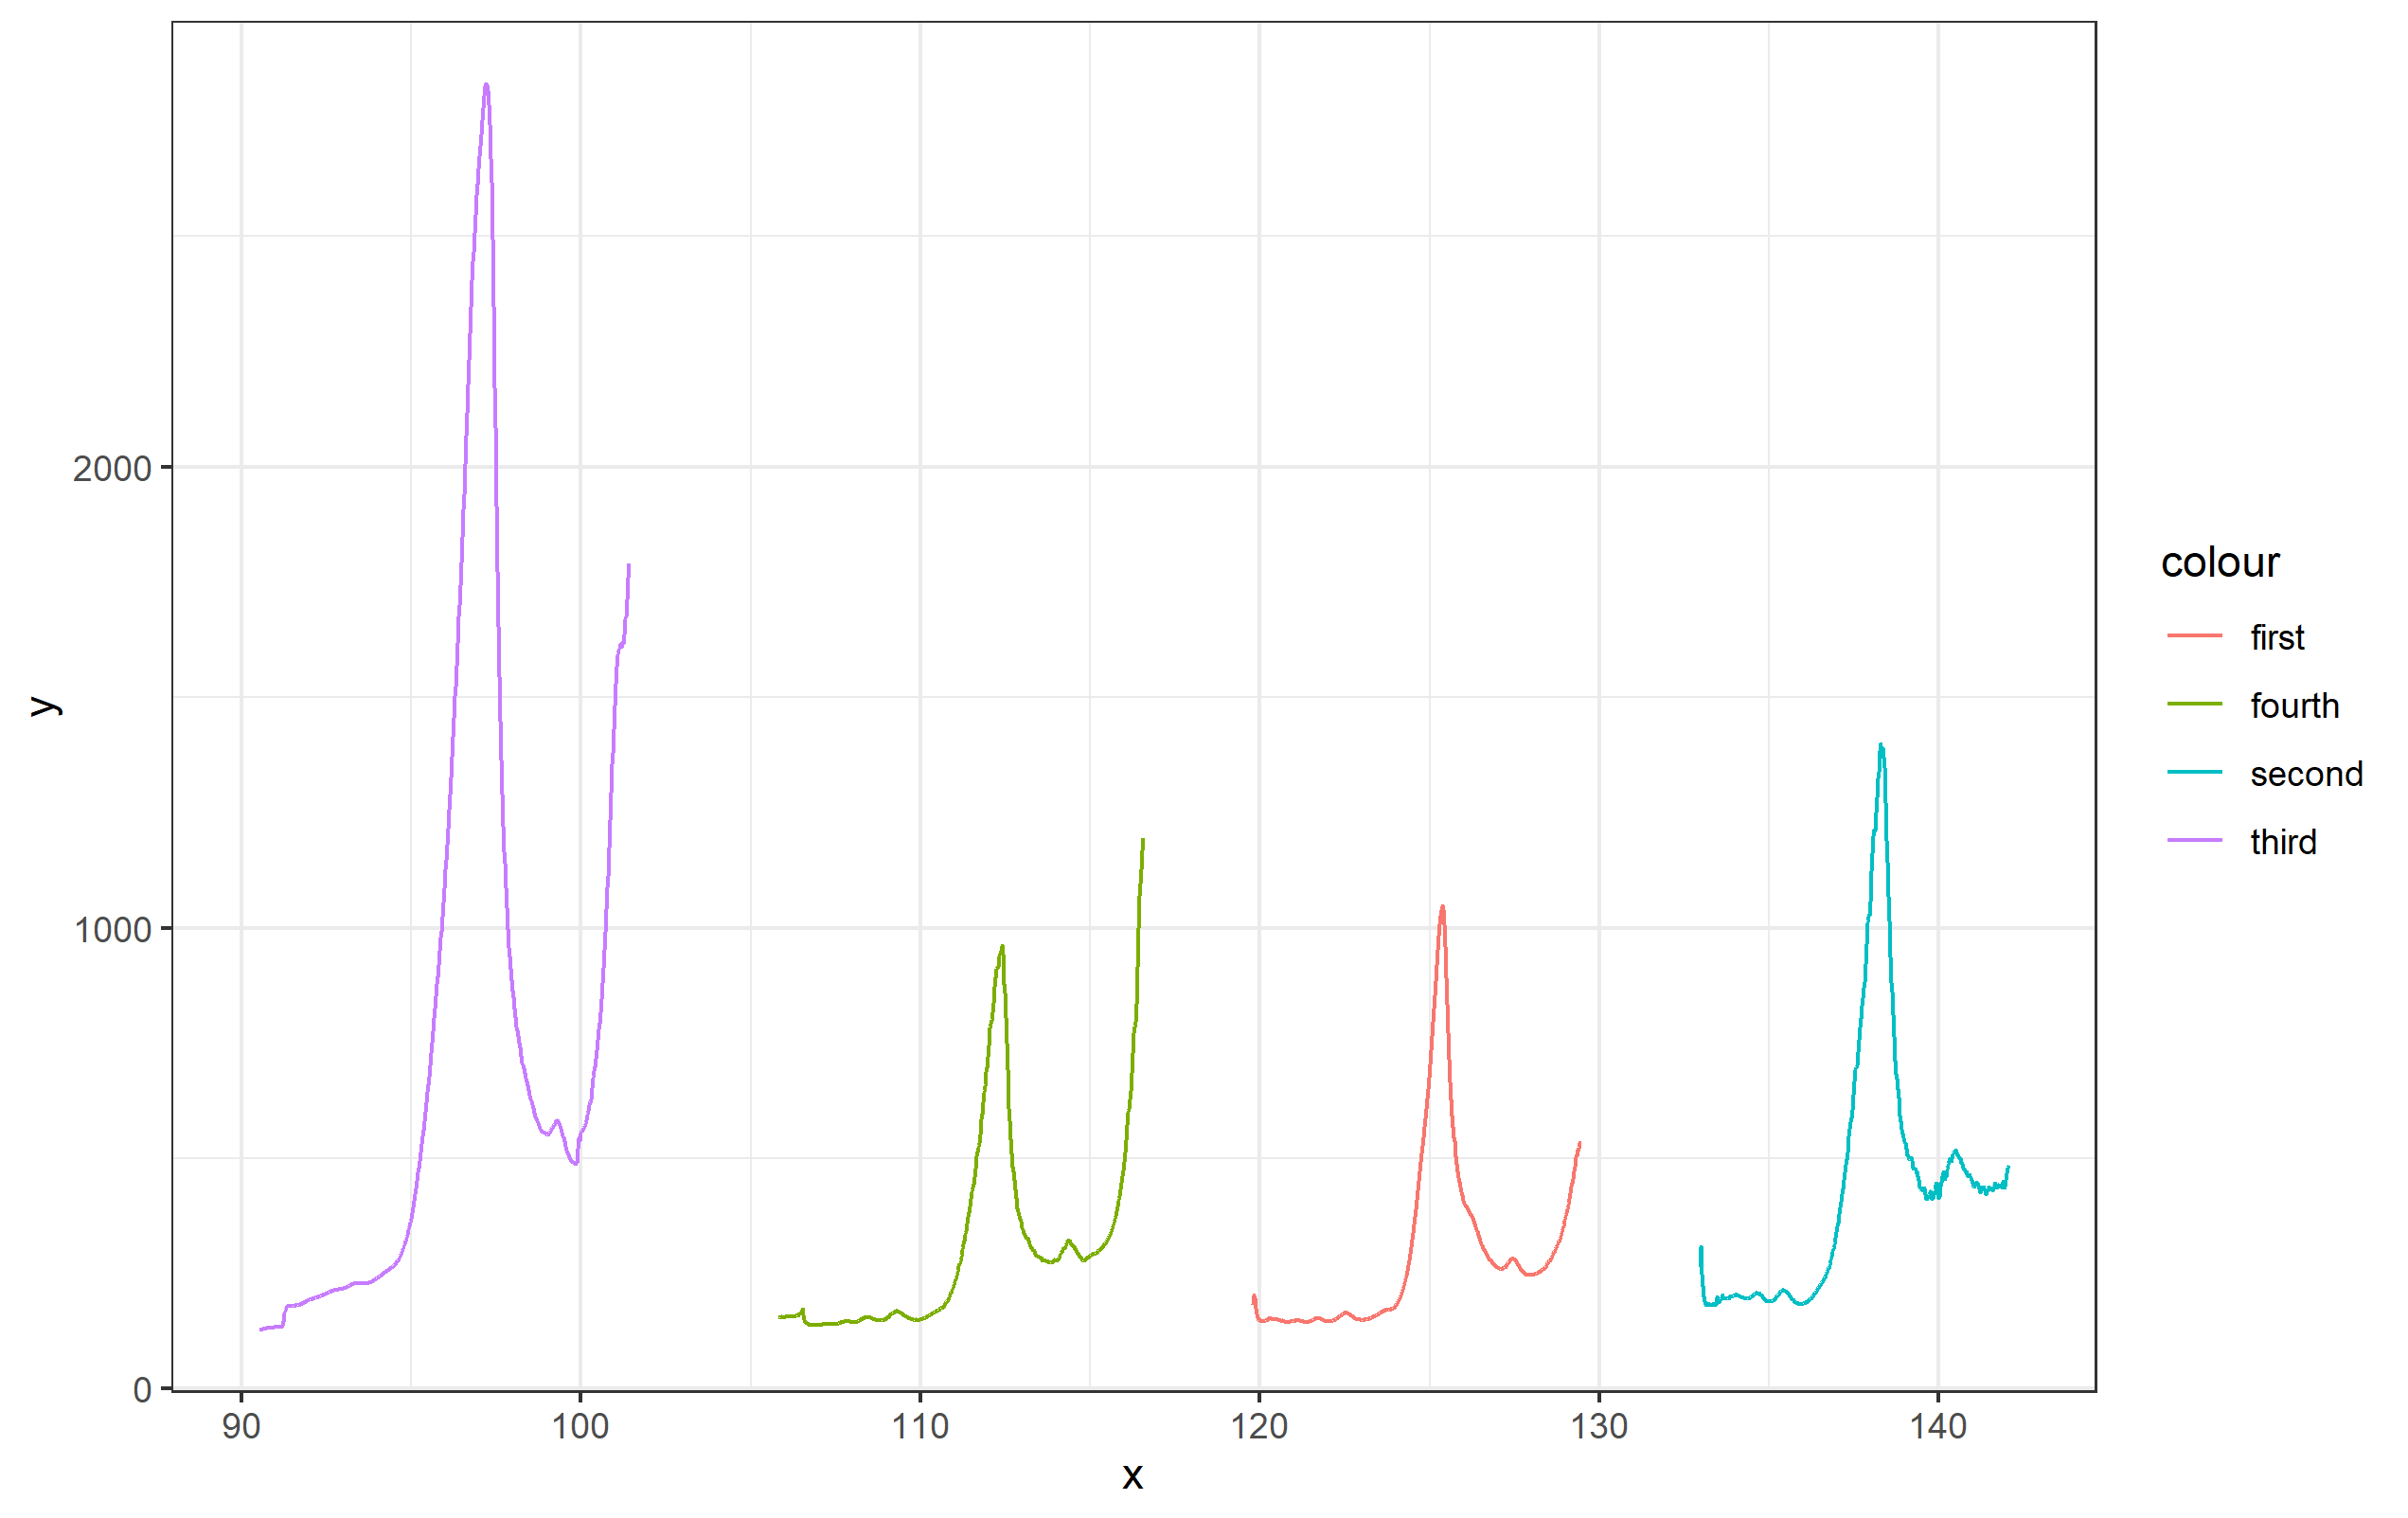
- 查找每个数据集的峰值x值。
- 调整每个峰值x值以匹配第一个峰值x值。
- 将数据集和绘图组合在一起它尊重Tidy数据原则
找出峰值并调整x值
为了找到峰值,我喜欢使用来自findpeaks()库的pracma函数。为函数提供数据集的y值(按x值的增加排列),该函数将返回一个矩阵,每一行代表一个“峰值”,列为峰值的峰值、索引或数据集行的高度、峰值开始的位置和峰值结束的位置。举个例子,下面是我们如何应用这个原则以及结果在其中一个数据集上的表现:
library(pracma)

first <- arrange(first, x)  # arrange first by increasing x
findpeaks(first$y, sortstr = TRUE, npeaks=1)

        [,1] [,2] [,3] [,4]
[1,] 1047.54 402 286 515参数sortstr=表示我们希望先按“最高”排序的峰值列表,而我们只对选择第一个峰值感兴趣。在这种情况下,我们可以看到402是峰值的first中x,y值的索引。所以我们可以通过first[index,]$x访问这个x值。
这里我们可能关心的一个问题是,这可能不适用于fourth,因为y的最大值实际上不是感兴趣的峰值;然而,如果我们运行该函数并测试它,使用我们返回最高峰值的findpeaks()方法可以很好地工作:显然,函数没有在右边找到一个“峰值”,因为它有一个“向上”,而不是一个“向下”。
下面的函数处理我们需要完成的所有步骤:排列、查找峰值和调整峰值。
# find the minimum peak.  We know it's from third, but here's
# how you do it if you don't "know" that

peaks_first <- findpeaks(first$y, sortstr = TRUE, npeaks=1)
peaks_second <- findpeaks(second$y, sortstr = TRUE, npeaks=1)
peaks_third <- findpeaks(third$y, sortstr = TRUE, npeaks=1)
peaks_fourth <- findpeaks(fourth$y, sortstr = TRUE, npeaks=1)

# minimum peak x value
peak_x <- min(c(first[peaks_first[2],]$x, second[peaks_second[2],]$x, third[peaks_third[2],]$x, fourth[peaks_fourth[2],]$x))

# function to use to fix each dataset
fix_x <- function(peak_x, dataset) {
  dataset <- arrange(dataset, x)
  d_peak <- findpeaks(dataset$y, sortstr = TRUE, npeaks=1)
  d_peak_x <- dataset[d_peak[2],]$x
  x_adj <- peak_x - d_peak_x
  dataset$x <- dataset$x + x_adj
  return(dataset)
}

# apply and fix each dataset
fix_first <- fix_x(peak_x, first)
fix_second <- fix_x(peak_x, second)
fix_third <- fix_x(peak_x, third)
fix_fourth <- fix_x(peak_x, fourth)

# combine datasets
fix_first$measure <- 'First'
fix_second$measure <- 'Second'
fix_third$measure <- 'Third'
fix_fourth$measure <- 'Fourth'

fixed <- rbind(fix_first, fix_second, fix_third, fix_fourth)
fixed$measure <- factor(fixed$measure, levels=c('First','Second','Third','Fourth'))
密谋
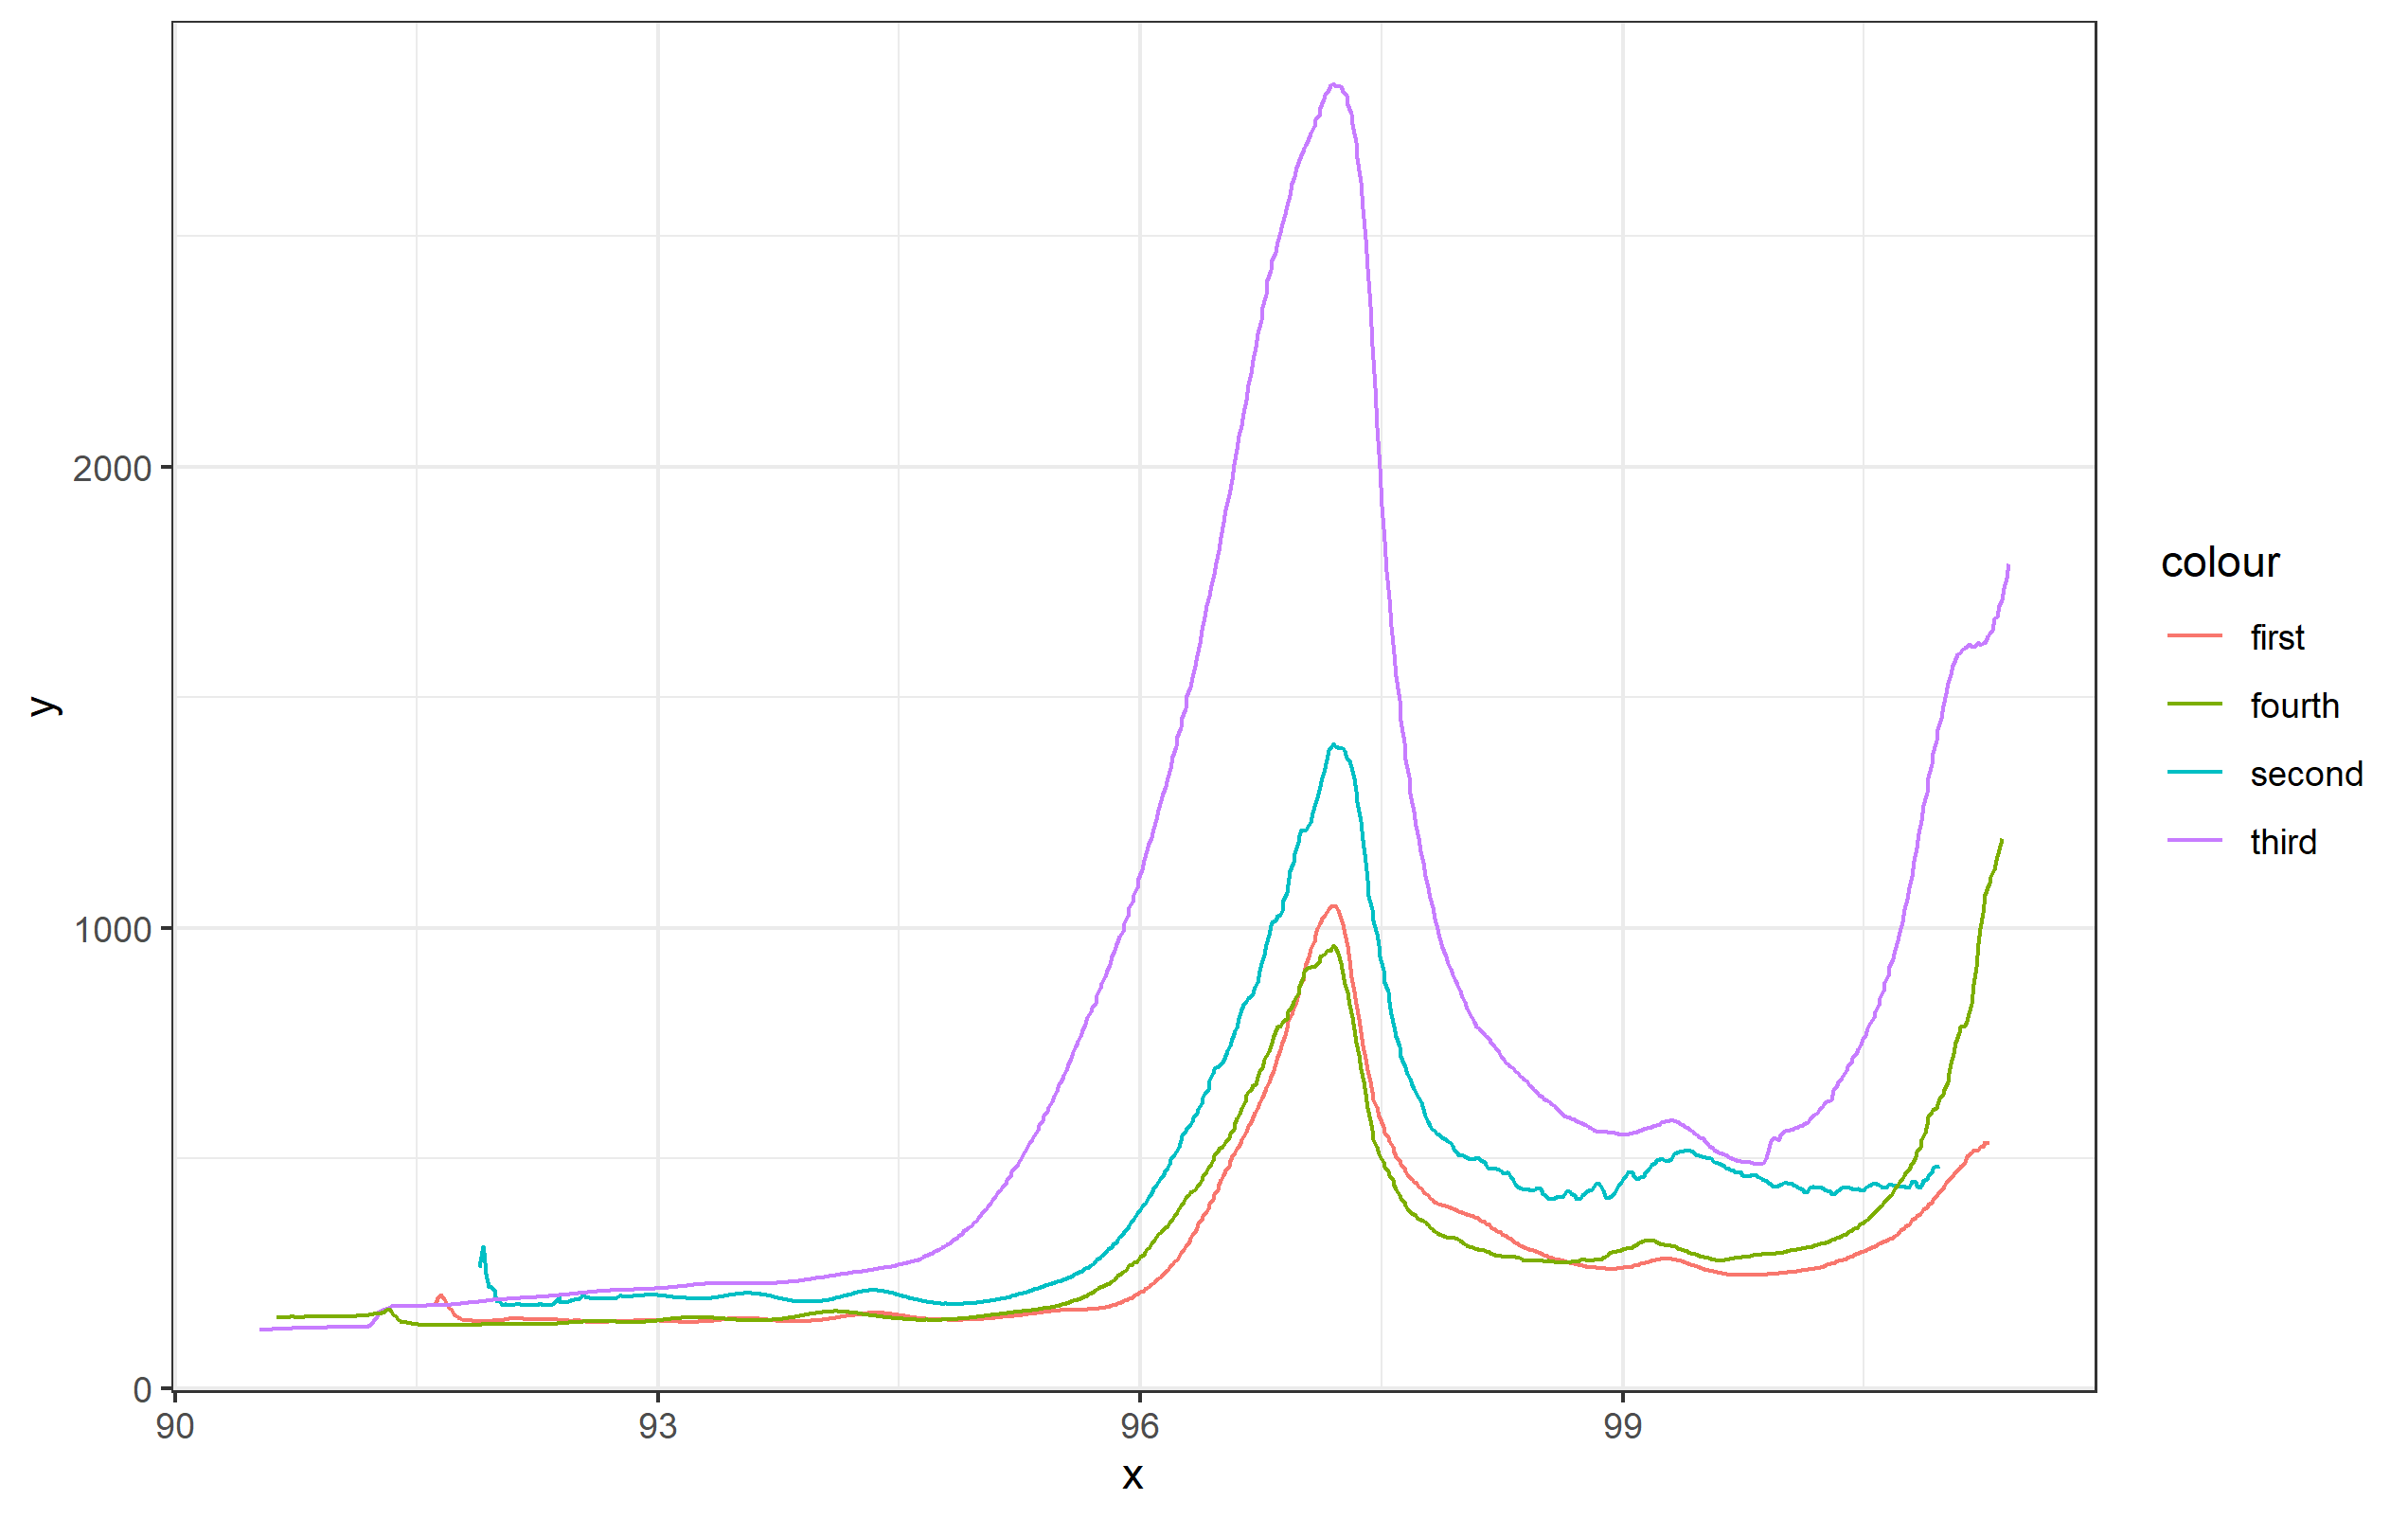
现在,fixed包含了所有的数据,我们可以将它们全部绘制在一起:
ggplot(fixed, aes(x=x, y=y, color=measure)) + theme_bw() +
  geom_line()
交替作图法
如果您想要将这些行“叠加”在一起,这就是所谓的脊线图。对于如何创建脊线图,我可以展示两种方法: faceting或使用ggridges和geom_ridgeline()。两样我都能演示。
# Using facets
ggplot(fixed, aes(x=x, y=y, color=measure)) + theme_bw() +
  geom_line(show.legend = FALSE) +
  facet_grid(measure~.)
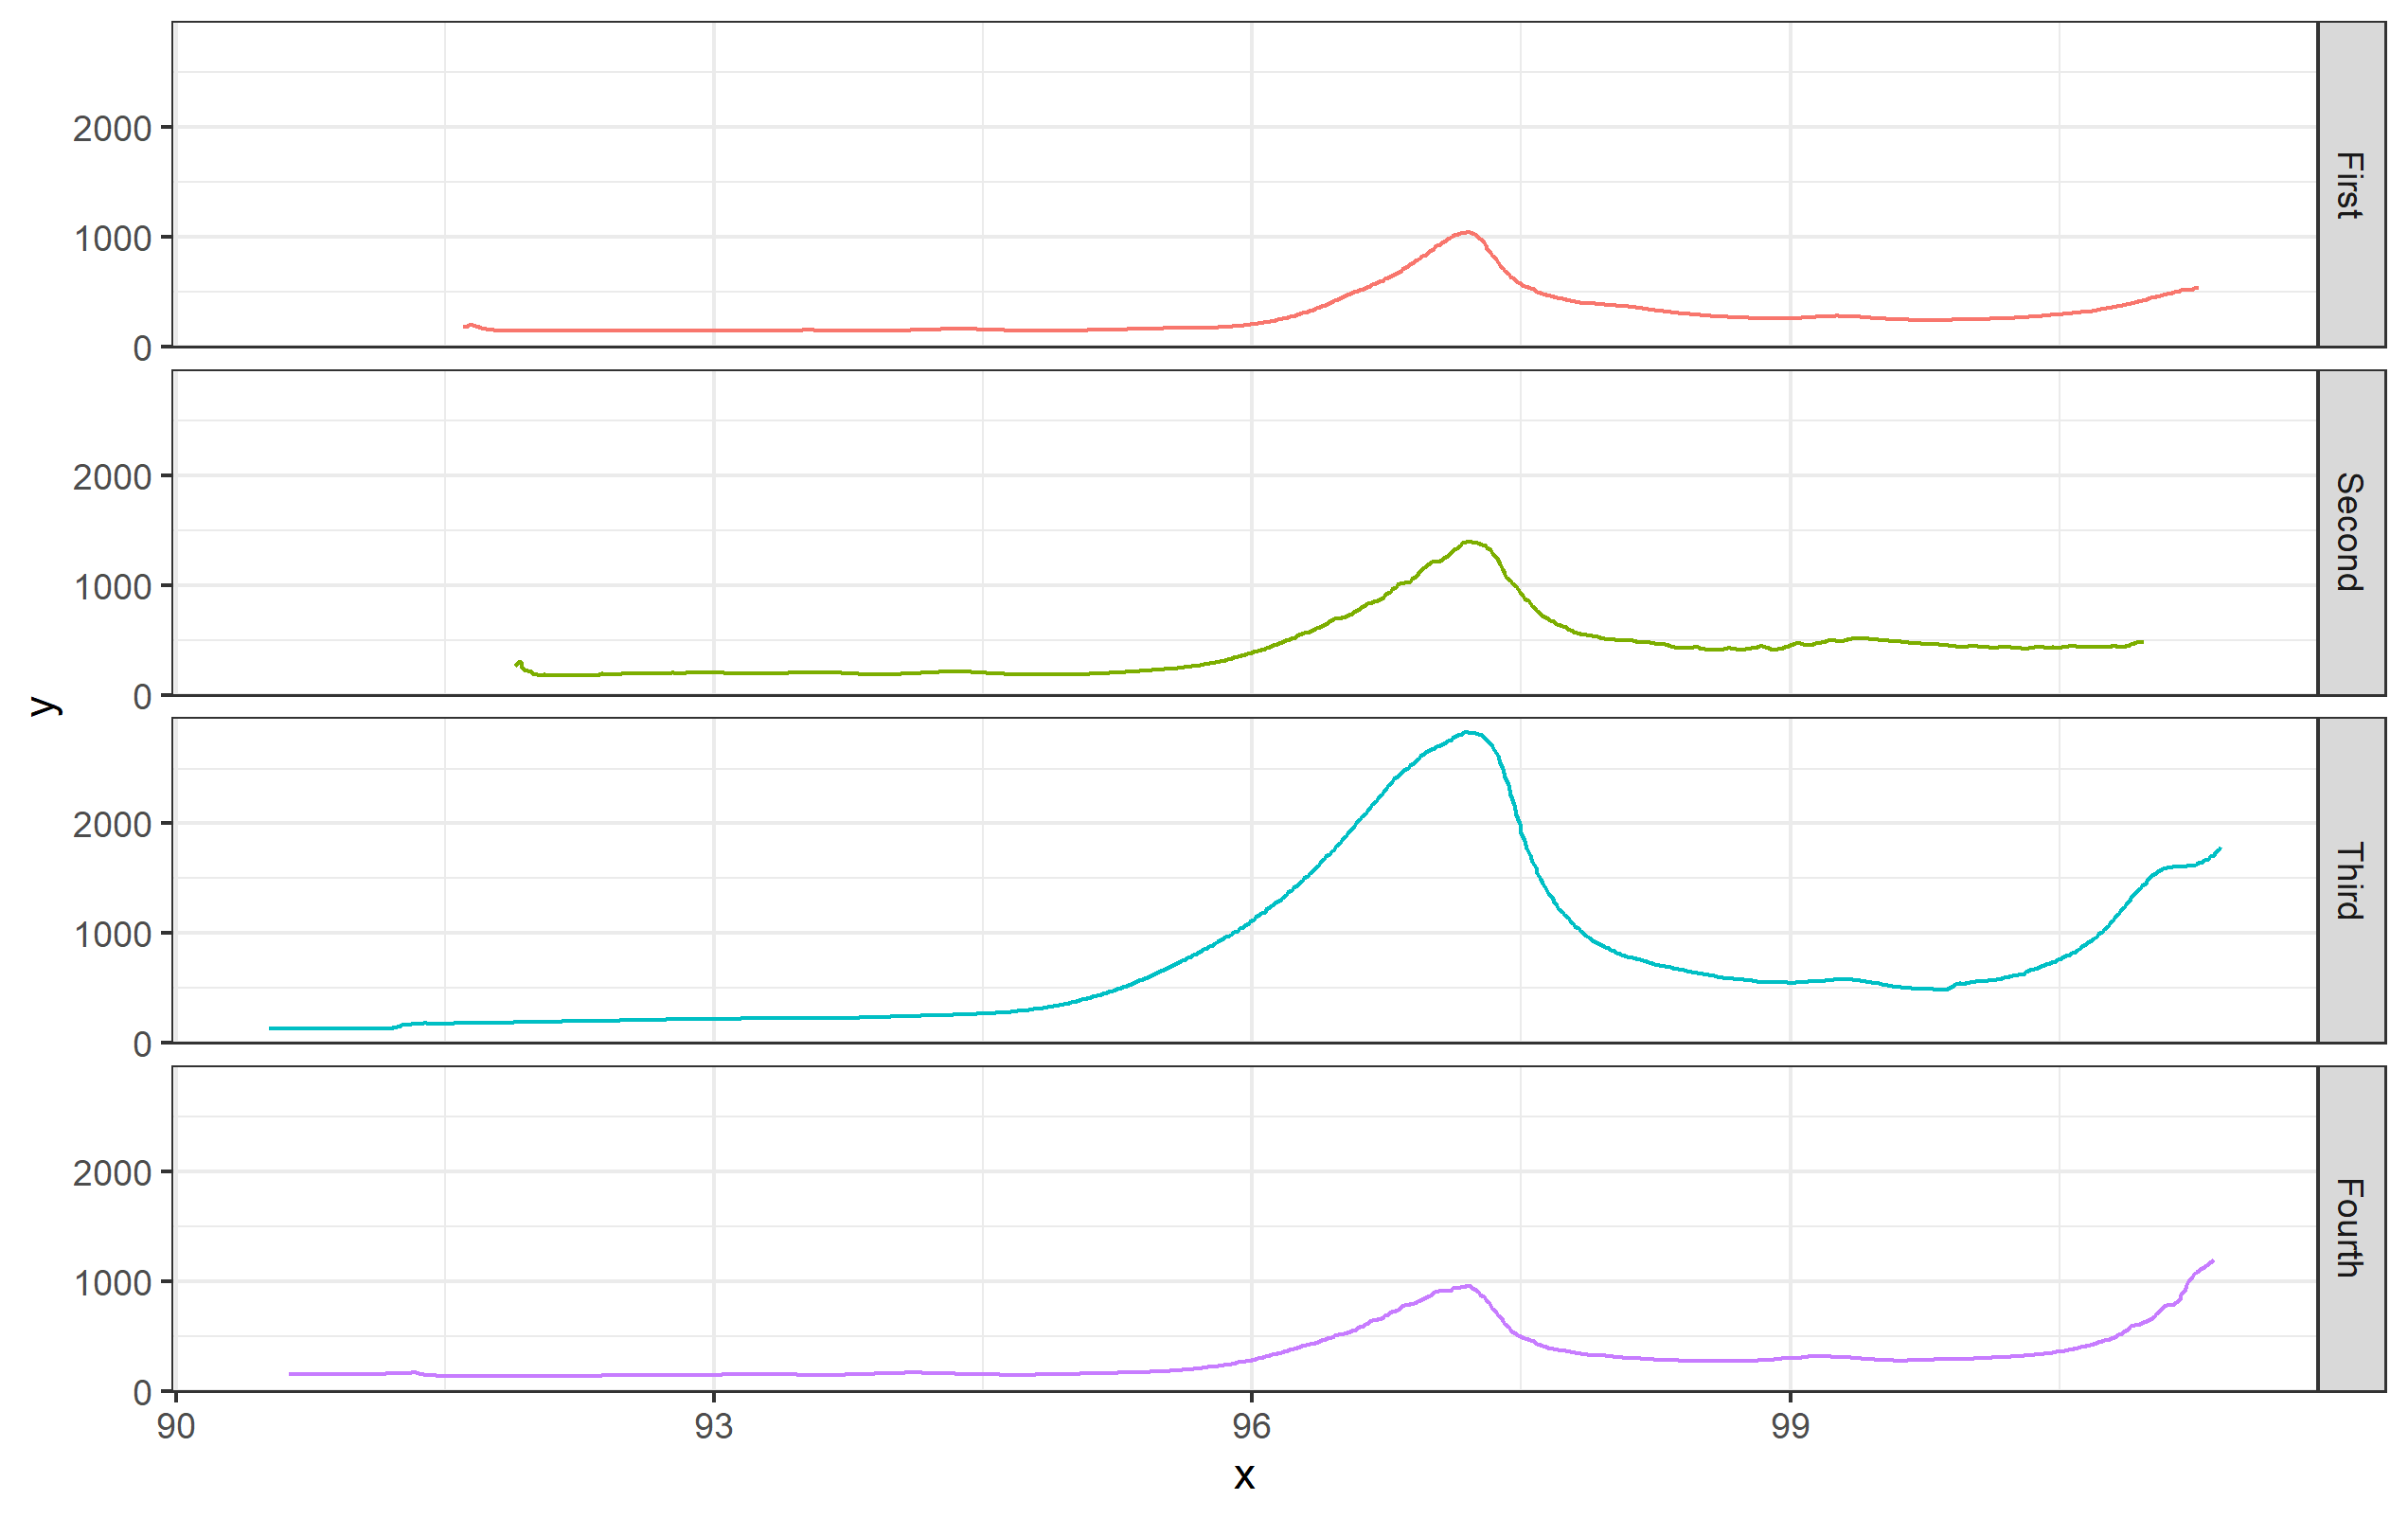
注意,我选择不显示图例,因为条形文本表示相同的信息。
# Using ggridges and geom_ridgeline
ggplot(fixed, aes(x=x, y=measure, color=measure)) + theme_bw() +
  geom_ridgeline(aes(height=y), fill=NA, scale=0.001)
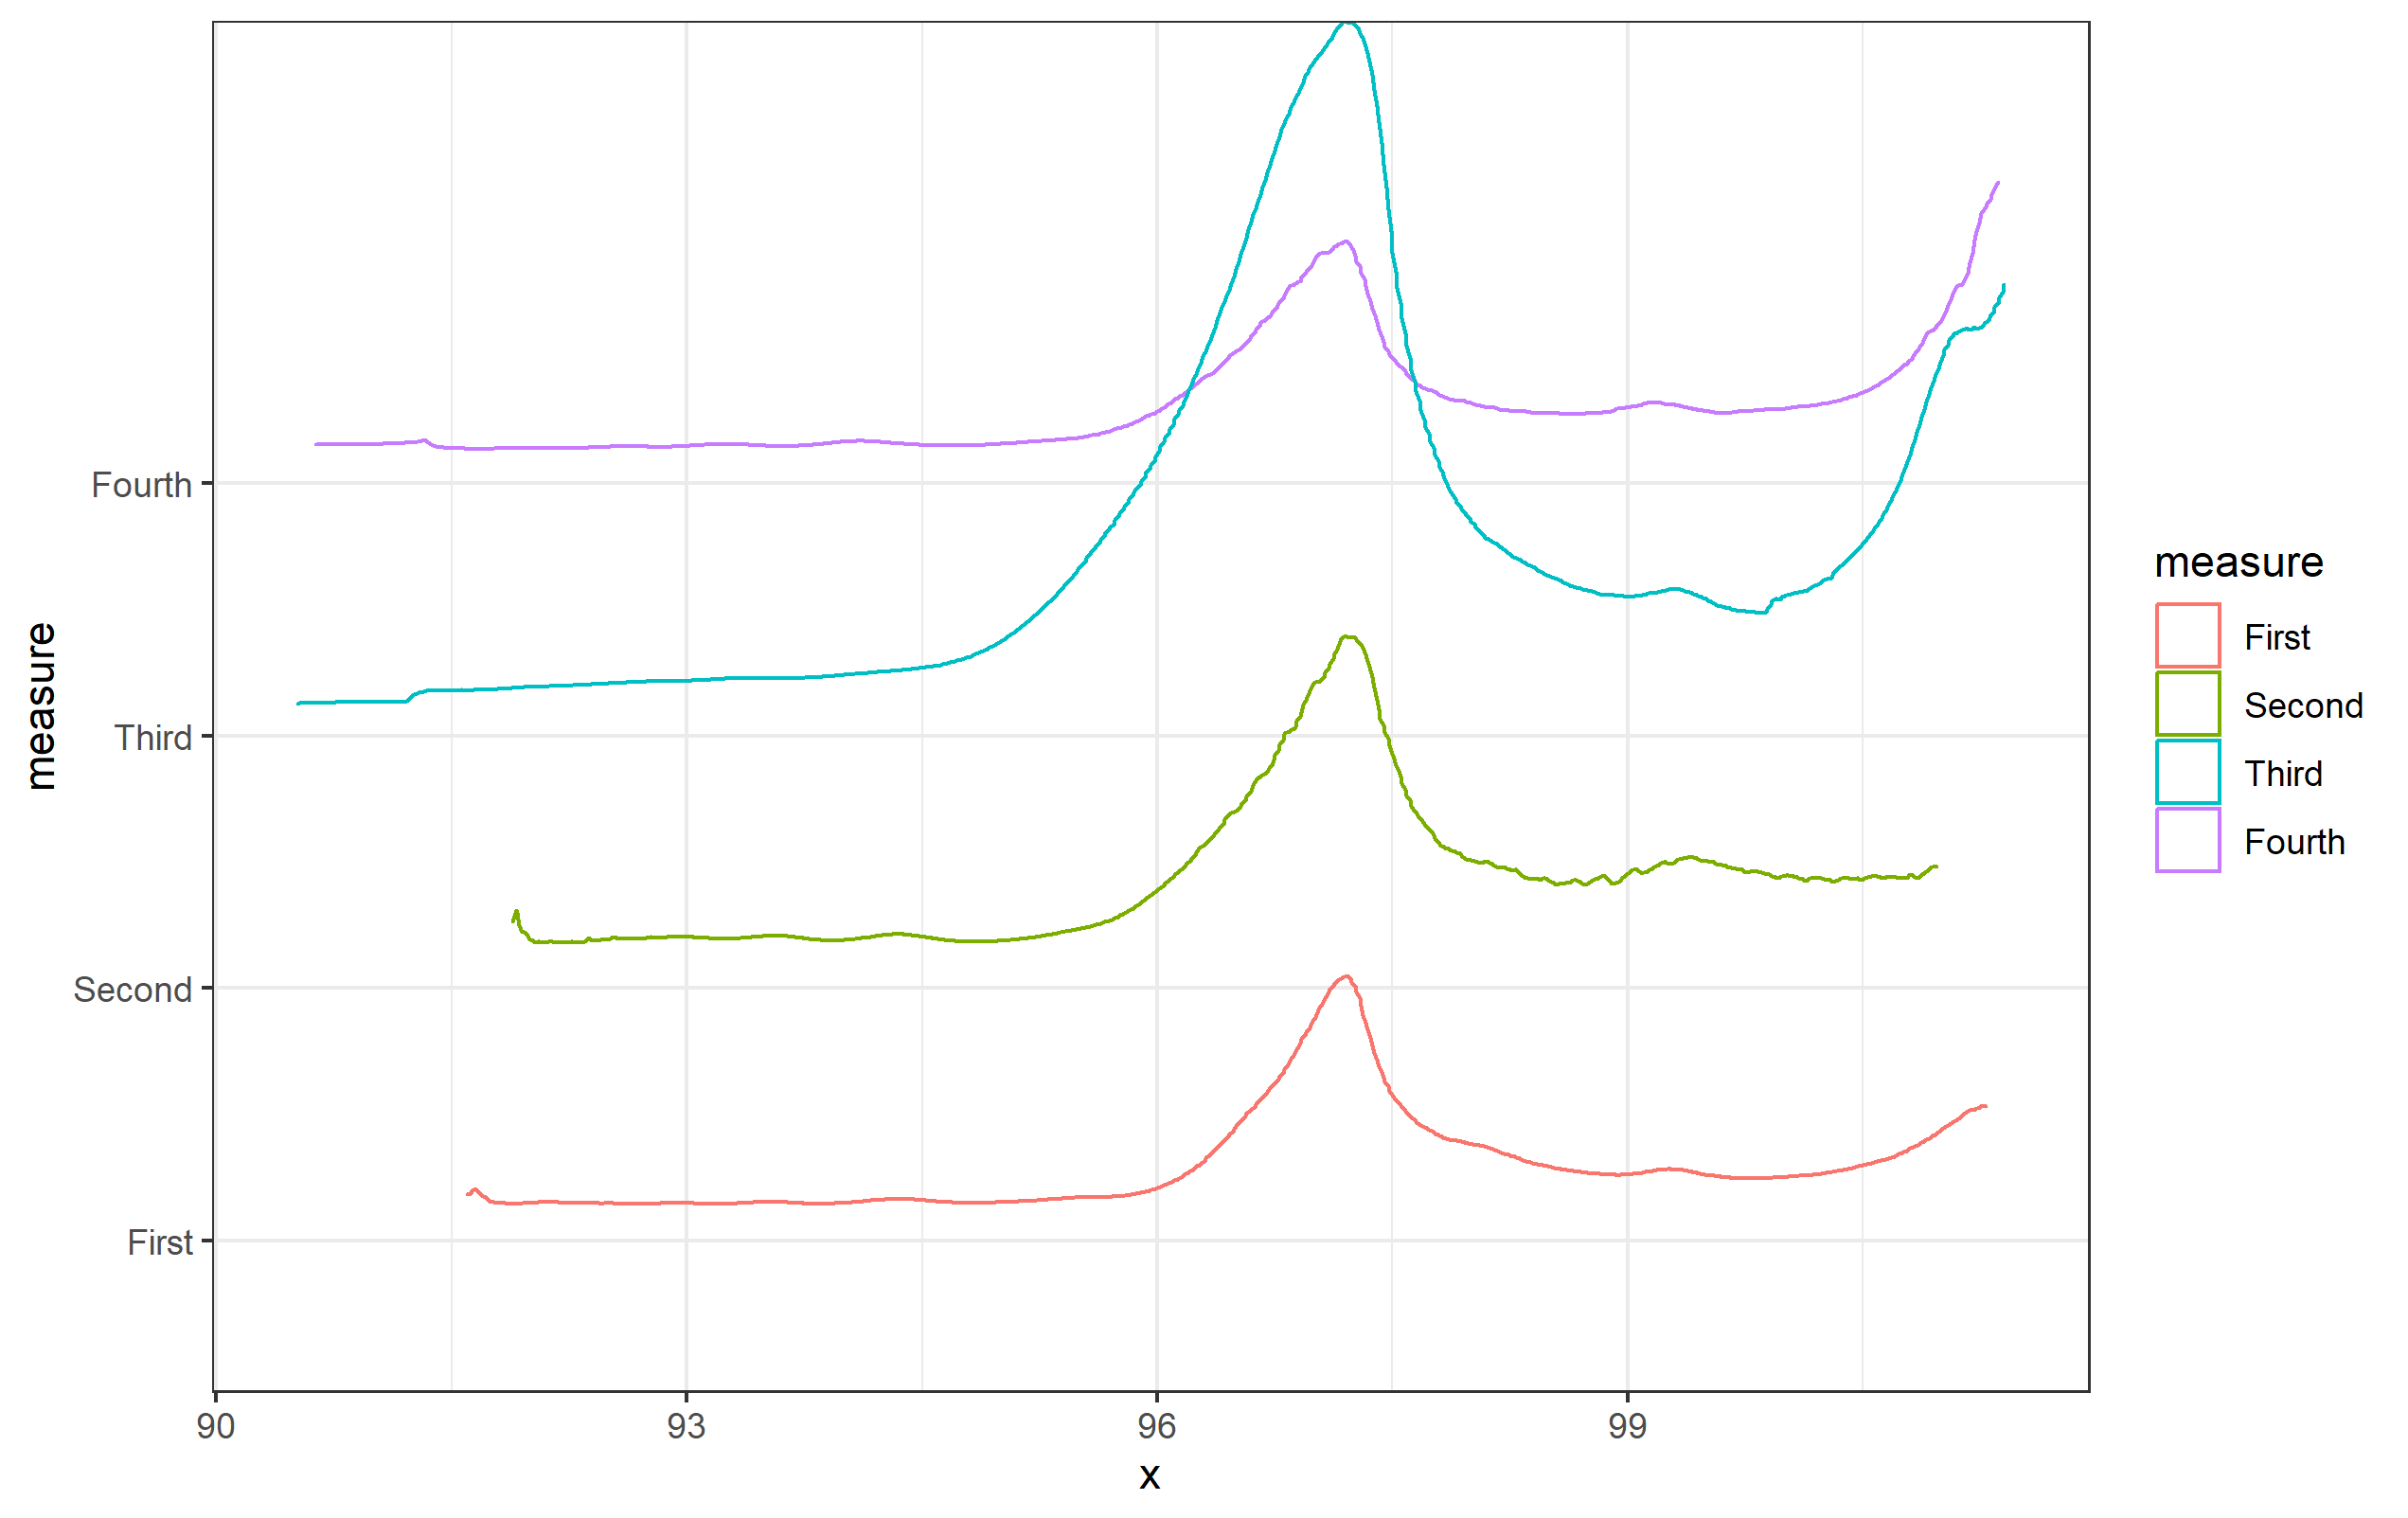
在使用geom_ridgeline()时,您会注意到y=美学变成了用于堆叠的列,而原来的y值则被映射到height=美学。我还必须使用scale=,因为对于离散值,每个measure将被视为整数(1、2、3、4)。您的height=值高于此值,因此我们必须缩小它们,使它们在此范围内(缩小约1,000)。
https://stackoverflow.com/questions/63470283
复制


![[PyQt Tutorial]7.QDialog 类](https://ask.qcloudimg.com/http-save/yehe-7663024/ywp8to5qrx.png)


相似问题
PY Qt从QDialog打开QMainWindow
如何在QDialog中显示QMainWindow
打开QMainWindow后从静态函数运行QDialog对象
如何从QDialog访问QMainWindow中的小部件
如何从QMainWindow刷新/更新/重绘QDialog?
领取专属 10元无门槛券
AI混元助手 在线答疑

洞察 腾讯核心技术
剖析业界实践案例

腾讯云开发者
