
矩阵库中基于x轴的直方图颜色变化方法
提问于 2021-12-02 07:40:39
我把这个直方图从熊猫的数据中计算出来。
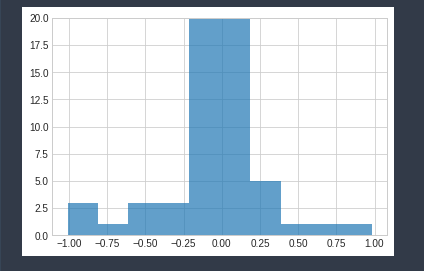
我想根据x轴值改变颜色.
例如:
If the value is = 0 the color should be green
If the value is > 0 the color should be red
If the value is < 0 the color should be yellow
我只关心x轴。酒吧的高度对我来说并不重要。所有其他的解都是关于y轴的.

回答 2
Stack Overflow用户
回答已采纳
发布于 2021-12-05 23:52:49
对于ax.containers[0]中的每个条形修补程序,根据x位置使用set_color:
进行测试
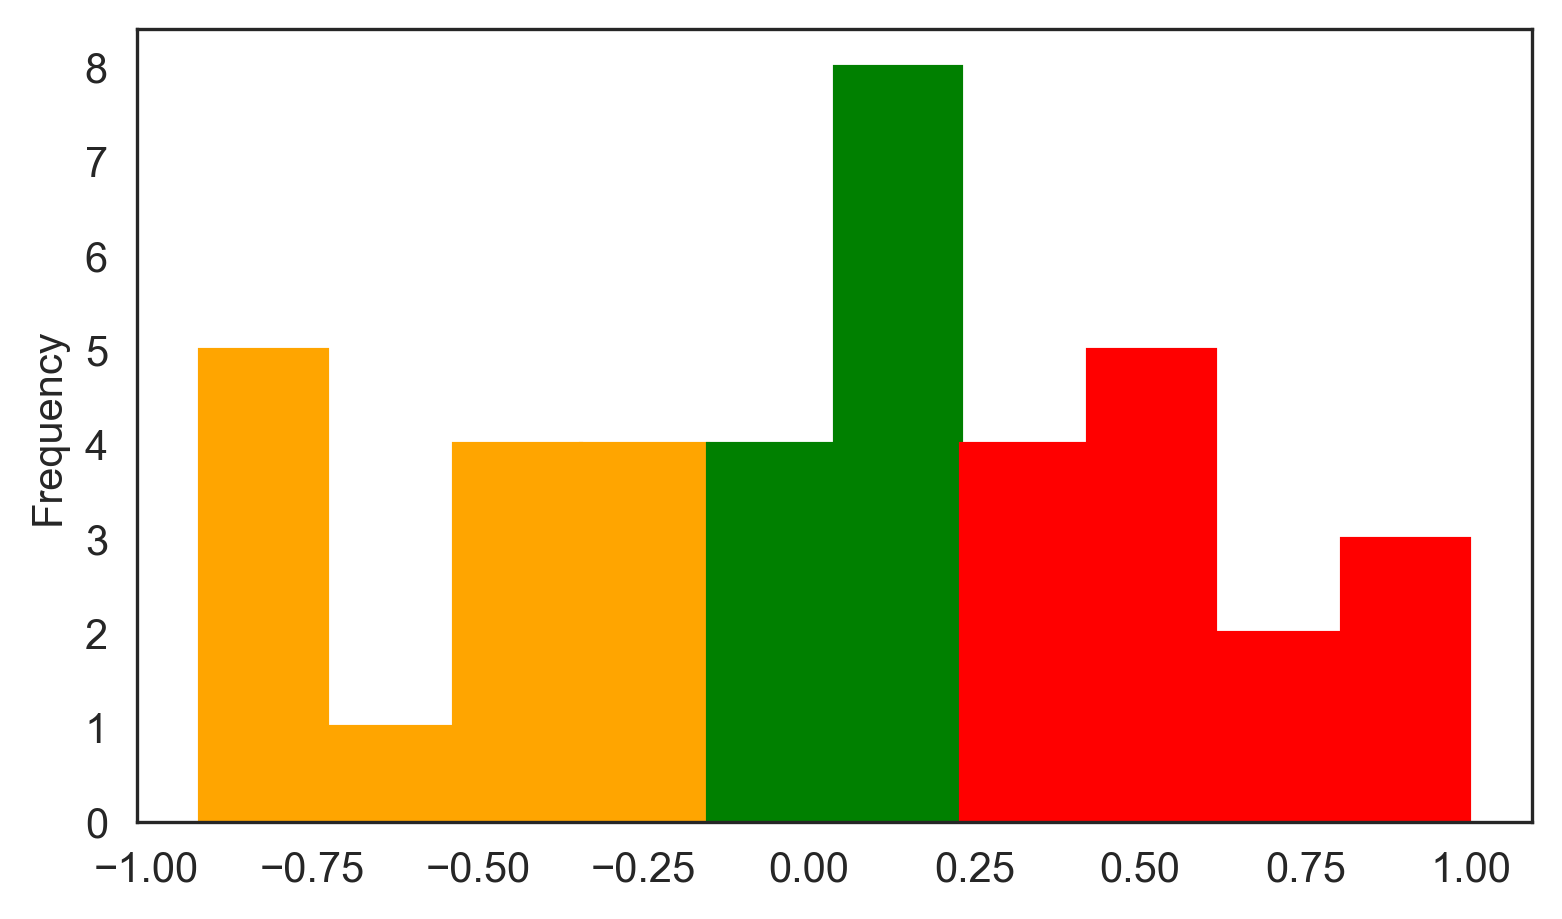
由于您是asked for pandas in the comments,所以这个示例使用DataFrame.plot.hist,但是您可以使用任何基于matplotlib的直方图/条形图来实现这一点:
df = pd.DataFrame({'A': np.random.default_rng(222).uniform(-1, 1, 40)})
ax = df.plot.hist()

for bar in ax.containers[0]:
    # get x midpoint of bar
    x = bar.get_x() + 0.5 * bar.get_width()

    # set bar color based on x
    if x < -0.2:
        bar.set_color('orange')
    elif x > 0.2:
        bar.set_color('red')
    else:
        bar.set_color('green')
Stack Overflow用户
发布于 2021-12-02 07:48:13
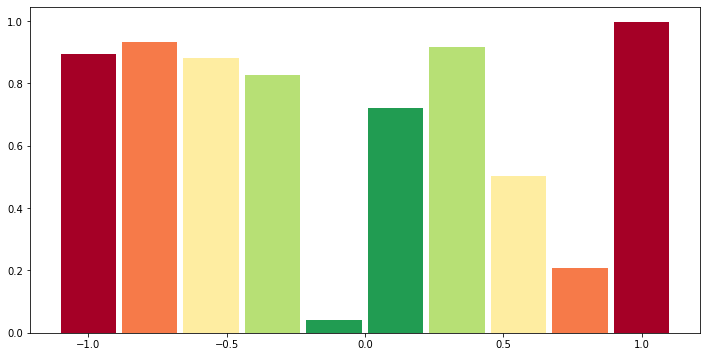
把他们一个一个地画出来:
import matplotlib as mpl
import matplotlib.pyplot as plt

x = np.linspace(-1,1,10)
y = np.random.uniform(0,1,10)
width = 0.2
plt.figure(figsize = (12, 6))
cmap = mpl.cm.RdYlGn.reversed()
norm = mpl.colors.Normalize(vmin=0, vmax=10)
for x0, y0 in zip(x,y):
    plt.bar(x0, y0, width = width, color = cmap(norm(np.abs(x0*10))))
页面原文内容由Stack Overflow提供。腾讯云小微IT领域专用引擎提供翻译支持
原文链接:
https://stackoverflow.com/questions/70202374
复制相关文章


腾讯云开发者
