
如何将传说置于情节之外
提问于 2011-01-15 08:10:03
我有一系列的20个情节(而不是副片)要在一个数字。我希望传奇能被打破。同时,我不想改变轴线,因为这个数字的大小被缩小了。
- 我想把图例框放在情节区域之外(我希望图例在情节区域的右侧)。
- 是否有办法缩小图例框内文字的字体大小,使图例框的大小变小?

回答 16
Stack Overflow用户
回答已采纳
发布于 2011-01-15 08:21:37
- 通过指定
set_sizeofFontProperties,可以使图例文本变小。 - 资源:
- 图例指南
matplotlib.legendmatplotlib.pyplot.legendmatplotlib.font_managerset_size(self, size)- 有效字体大小为xx-小,x-小,小,中,大,x-大,xx-大,大,小,无.
- [Real Python: Python Plotting With Matplotlib (Guide)](https://realpython.com/python-matplotlib-guide/)import matplotlib.pyplot as plt
from matplotlib.font_manager import FontProperties
fontP = FontProperties()
fontP.set_size('xx-small')
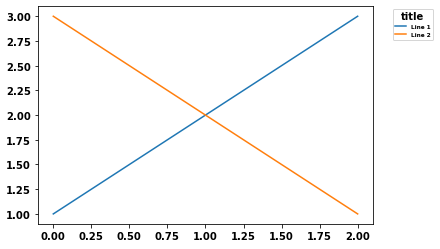
p1, = plt.plot([1, 2, 3], label='Line 1')
p2, = plt.plot([3, 2, 1], label='Line 2')
plt.legend(handles=[p1, p2], title='title', bbox_to_anchor=(1.05, 1), loc='upper left', prop=fontP)
fontsize='xx-small'也可以工作,无需导入FontProperties。
plt.legend(handles=[p1, p2], title='title', bbox_to_anchor=(1.05, 1), loc='upper left', fontsize='xx-small')Stack Overflow用户
发布于 2011-01-15 10:12:27
有很多方法可以做你想做的事。要将图例添加到什么基督教和纳维已经说过中,可以使用bbox_to_anchor关键字参数将图例部分置于轴外和/或减小字体大小。
在考虑缩小字体大小(这会使人很难读懂)之前,试着在不同的地方放置图例:
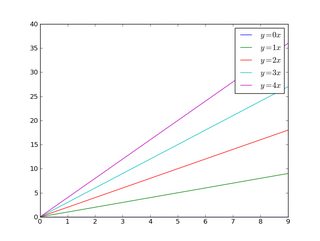
那么,让我们从一个通用示例开始:
import matplotlib.pyplot as plt
import numpy as np

x = np.arange(10)

fig = plt.figure()
ax = plt.subplot(111)

for i in xrange(5):
    ax.plot(x, i * x, label='$y = %ix$' % i)

ax.legend()

plt.show()
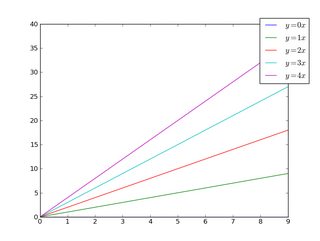
如果我们做同样的事情,但是使用bbox_to_anchor关键字参数,我们可以将图例稍微移出轴的边界:
import matplotlib.pyplot as plt
import numpy as np

x = np.arange(10)

fig = plt.figure()
ax = plt.subplot(111)

for i in xrange(5):
    ax.plot(x, i * x, label='$y = %ix$' % i)

ax.legend(bbox_to_anchor=(1.1, 1.05))

plt.show()
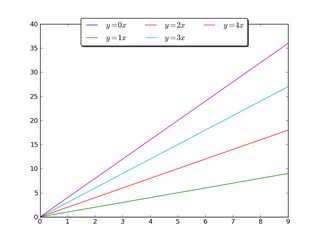
类似地,使图例更横向和/或将其放在图形的顶部(我还打开圆角和一个简单的下垂阴影):
import matplotlib.pyplot as plt
import numpy as np

x = np.arange(10)

fig = plt.figure()
ax = plt.subplot(111)

for i in xrange(5):
    line, = ax.plot(x, i * x, label='$y = %ix$'%i)

ax.legend(loc='upper center', bbox_to_anchor=(0.5, 1.05),
          ncol=3, fancybox=True, shadow=True)
plt.show()
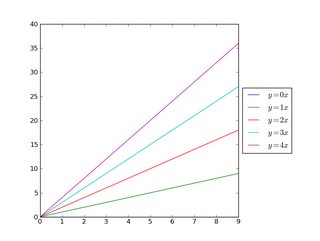
或者,缩小当前绘图的宽度,并将图例完全置于图形轴之外(注意:如果使用tight_layout(),则省略ax.set_position()
import matplotlib.pyplot as plt
import numpy as np

x = np.arange(10)

fig = plt.figure()
ax = plt.subplot(111)

for i in xrange(5):
    ax.plot(x, i * x, label='$y = %ix$'%i)

# Shrink current axis by 20%
box = ax.get_position()
ax.set_position([box.x0, box.y0, box.width * 0.8, box.height])

# Put a legend to the right of the current axis
ax.legend(loc='center left', bbox_to_anchor=(1, 0.5))

plt.show()
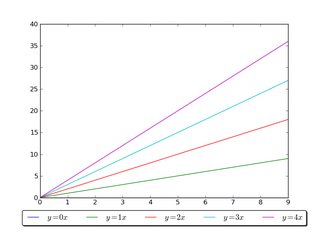
以类似的方式,垂直缩小地块,并在底部放一个水平图例:
import matplotlib.pyplot as plt
import numpy as np

x = np.arange(10)

fig = plt.figure()
ax = plt.subplot(111)

for i in xrange(5):
    line, = ax.plot(x, i * x, label='$y = %ix$'%i)

# Shrink current axis's height by 10% on the bottom
box = ax.get_position()
ax.set_position([box.x0, box.y0 + box.height * 0.1,
                 box.width, box.height * 0.9])

# Put a legend below current axis
ax.legend(loc='upper center', bbox_to_anchor=(0.5, -0.05),
          fancybox=True, shadow=True, ncol=5)

plt.show()
看一看matplotlib图例指南。您还可以看看plt.figlegend()。
Stack Overflow用户
发布于 2014-07-02 18:43:20
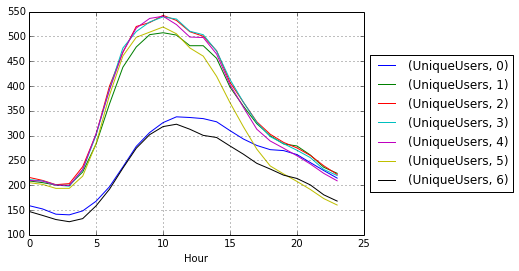
只需在这样的legend()调用之后调用plot():
# Matplotlib
plt.plot(...)
plt.legend(loc='center left', bbox_to_anchor=(1, 0.5))

# Pandas
df.myCol.plot().legend(loc='center left', bbox_to_anchor=(1, 0.5))
结果会是这样的:
页面原文内容由Stack Overflow提供。腾讯云小微IT领域专用引擎提供翻译支持
原文链接:
https://stackoverflow.com/questions/4700614
复制


腾讯云开发者
