
Matplotlib -如何将日期从SQLite转换为matplotlib格式?
提问于 2013-08-30 06:42:31
我有一个SQLite表的日期,我需要在matplotlib图形中显示为X。
"125","2013-08-30 13:33:11"
"120","2013-08-29 13:33:11"
"112","2013-08-28 13:33:11"
我需要用这个日期
plt.plot(prices, dates)如何将此日期格式转换为在绘图中使用?
诚挚的问候,

回答 1
Stack Overflow用户
回答已采纳
发布于 2013-08-30 06:56:01
您希望将日期转换为datetime对象。为此,请使用适合您的数据的格式的datetime.strptime方法。例如,数据是所有的表单。
'%Y-%m-%d %H:%M:%S'为了year-month-day hour:min:sec。因此,尝试类似于
import matplotlib.pyplot as plt
from matplotlib.dates import datetime as dt
raw_dates = ["2013-08-30 13:33:11", "2013-08-29 13:33:11", "2013-08-28 13:33:11"]
x = [dt.datetime.strptime(d, '%Y-%m-%d %H:%M:%S') for d in raw_dates]
y = [125, 120, 112]
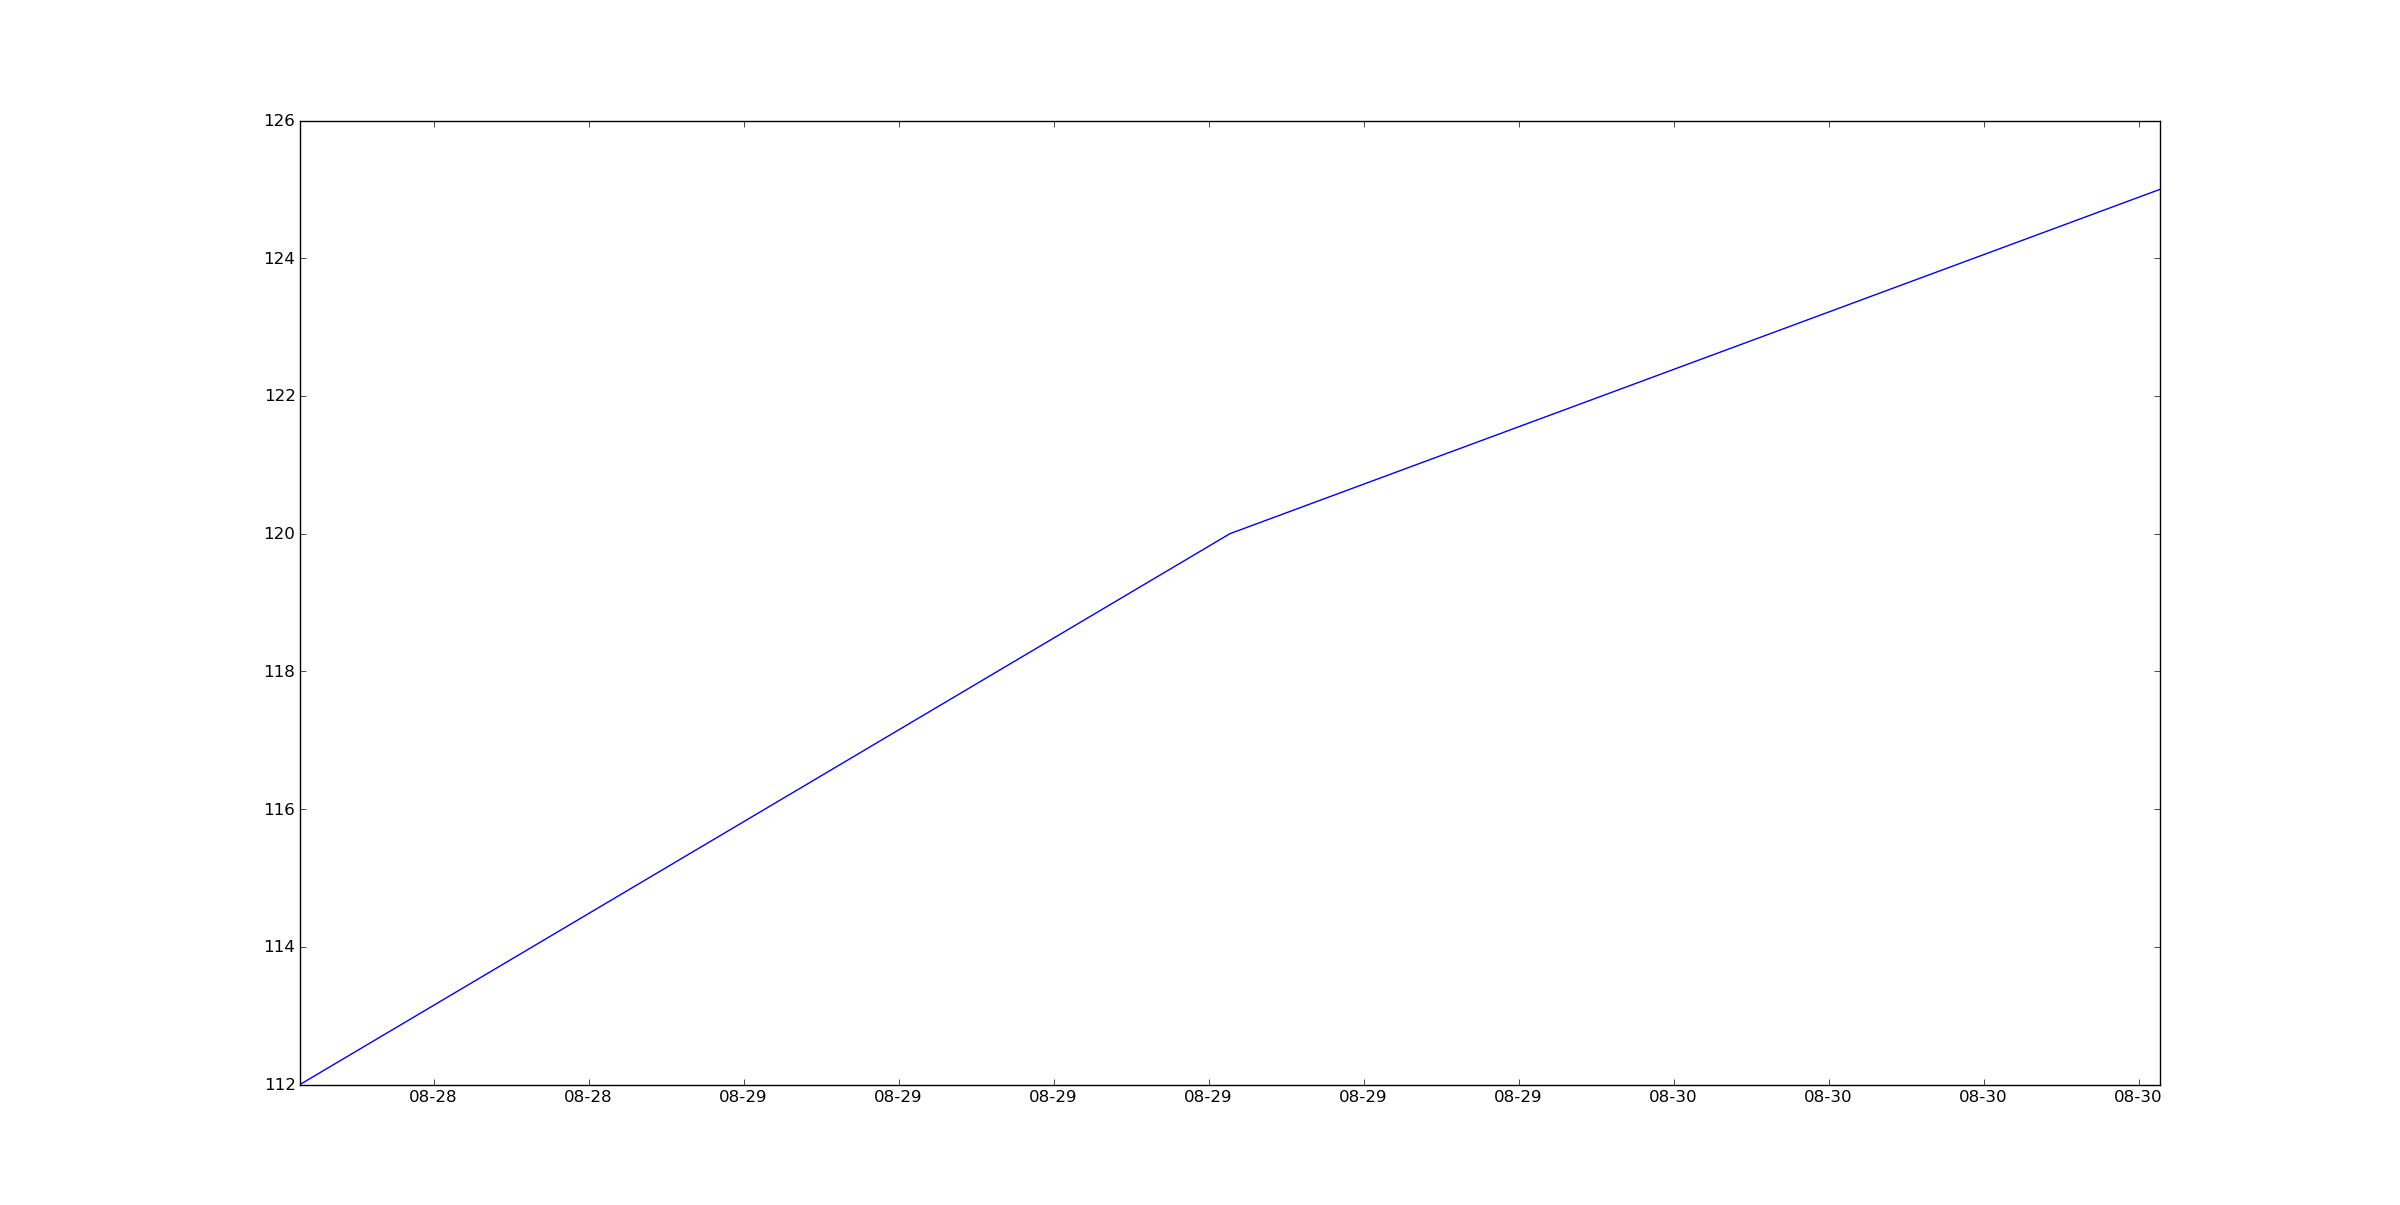
plt.plot(x, y)如果您想调整x轴上的值(我认为它们将显示为小时),您可以设置一个DateFormatter。
import matplotlib.pyplot as plt
from matplotlib.dates import datetime as dt
from matplotlib.dates import DateFormatter

formatter = DateFormatter('%m-%d')

f = plt.figure()
ax = f.add_subplot(111)

raw_dates = ["2013-08-30 13:33:11", "2013-08-29 13:33:11", "2013-08-28 13:33:11"]
x = [dt.datetime.strptime(d, '%Y-%m-%d %H:%M:%S') for d in raw_dates]
y = [125, 120, 112]
ax.plot(x, y)

ax.xaxis.set_major_formatter(formatter)
plt.show()
页面原文内容由Stack Overflow提供。腾讯云小微IT领域专用引擎提供翻译支持
原文链接:
https://stackoverflow.com/questions/18535662
复制


腾讯云开发者
