树状图ggplot2 R上具有梯度的不同颜色
树状图ggplot2 R上具有梯度的不同颜色
提问于 2018-05-03 12:06:08
我有一个树状图(如下所示)。我唯一想做的改变是将子组(图中的年份)的颜色更改为不同的颜色,而不是所有的蓝色。这有可能吗?
样本数据帧
PL <- c(rep("PL1", 4), repl("PL2", 4), rep("PL3", 4), rep("PL4", 4))
CNT <- sample(seq(1:50), 16)
YEAR <- rep(c("2015", "2016", "2017", "2018"), 4)

df <- data.frame(PL, YEAR, CNT)
图
PL <- c(rep("PL1", 4), repl("PL2", 4), rep("PL3", 4), rep("PL4", 4))
    CNT <- sample(seq(1:50), 16)
    YEAR <- rep(c("2015", "2016", "2017", "2018"), 4)

    df <- data.frame(PL, YEAR, CNT)

    # plot
library(ggplot2)
library(treemapify)
treeMapPlot <- ggplot(df, aes(area = CNT,
                              fill = CNT,
                              label=PL,
                              subgroup=YEAR)) +
      geom_treemap() +
      geom_treemap_subgroup_border(colour = "white") +
      geom_treemap_text(fontface = "italic",
                        colour = "white",
                        place = "centre",
                        grow = F,
                        reflow = T) +
      geom_treemap_subgroup_text(place = "centre",
                                 grow = T,
                                 alpha = 0.5,
                                 colour = "#FAFAFA",
                                 min.size = 0)

treeMapPlot
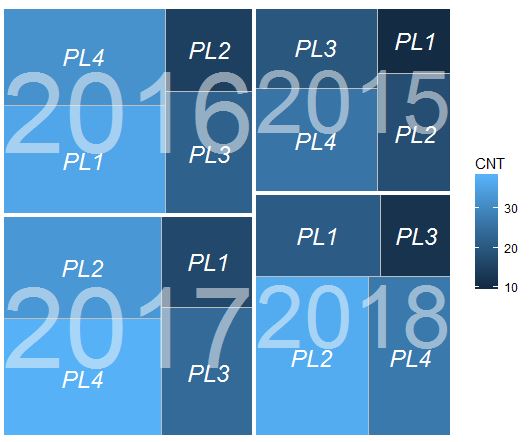
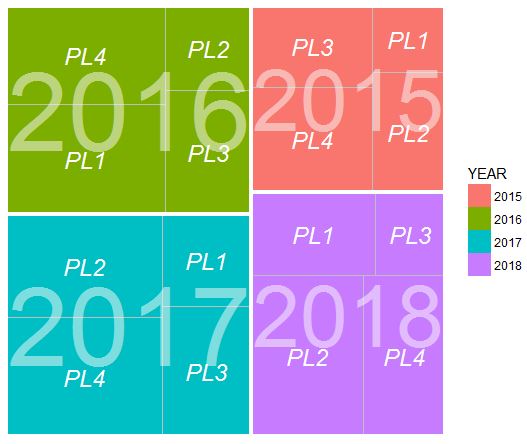
如果我改变了fill在aes,我可以得到这个,但我失去了梯度。我需要保留这些颜色,但是显示渐变颜色,意味着小的CNT更轻,更大的CNT更深。
treeMapPlot <- ggplot(df, aes(area = CNT,
                              fill = YEAR,
                              label = PL,
                              subgroup = YEAR))
回答 2
Stack Overflow用户
回答已采纳
发布于 2018-05-03 12:34:17
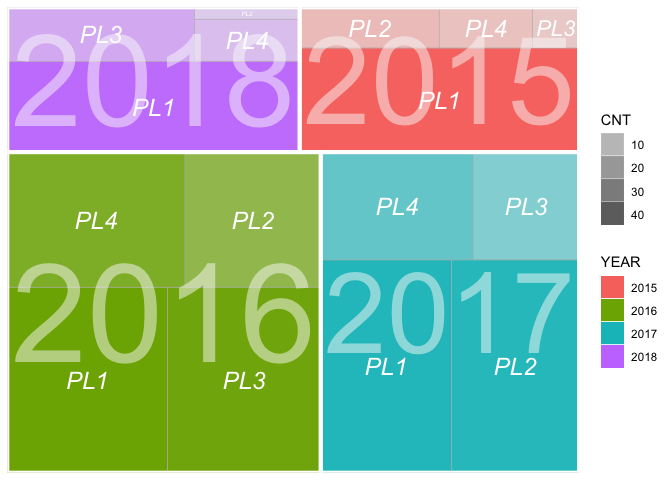
这不是最美丽的解决方案,但映射计数到阿尔法模拟的每种颜色的光到暗的梯度。在aes(alpha = CNT)中添加geom_treemap,并根据需要缩放alpha。
library(ggplot2)
library(treemapify)

PL <- c(rep("PL1",4),rep("PL2",4),rep("PL3",4),rep("PL4",4))
CNT <- sample(seq(1:50),16)
YEAR <- rep(c("2015","2016","2017","2018"),4)

df <- data.frame(PL,YEAR,CNT)

ggplot(df, aes(area = CNT, fill = YEAR, label=PL, subgroup=YEAR)) +

# change this line
    geom_treemap(aes(alpha = CNT)) +
    geom_treemap_subgroup_border(colour="white") +
    geom_treemap_text(fontface = "italic",
                                        colour = "white",
                                        place = "centre",
                                        grow = F,
                                        reflow=T) +
    geom_treemap_subgroup_text(place = "centre",
                                                         grow = T,
                                                         alpha = 0.5,
                                                         colour = "#FAFAFA",
                                                         min.size = 0) +
    scale_alpha_continuous(range = c(0.2, 1))
由reprex封装创建于2018-05-03 (v0.2.0)。
编辑添加:基于这个职位的通过在一个更深的填充层的顶部放置一个α缩放层来入侵假梯度。这里我使用了两个geom_treemap,一个带有fill = "black",另一个带有alpha缩放。仍有一些有待改进的地方。
ggplot(df, aes(area = CNT, fill = YEAR, label=PL, subgroup=YEAR)) +
    geom_treemap(fill = "black") +
    geom_treemap(aes(alpha = CNT)) +
    geom_treemap_subgroup_border(colour="white") +
    geom_treemap_text(fontface = "italic",
                                        colour = "white",
                                        place = "centre",
                                        grow = F,
                                        reflow=T) +
    geom_treemap_subgroup_text(place = "centre",
                                                         grow = T,
                                                         alpha = 0.5,
                                                         colour = "#FAFAFA",
                                                         min.size = 0) +
    scale_alpha_continuous(range = c(0.4, 1))
由reprex封装创建于2018-05-03 (v0.2.0)。
Stack Overflow用户
发布于 2018-05-03 15:00:56
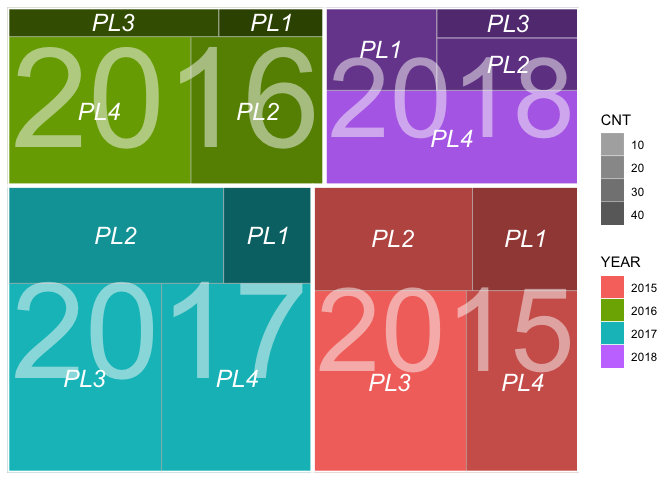
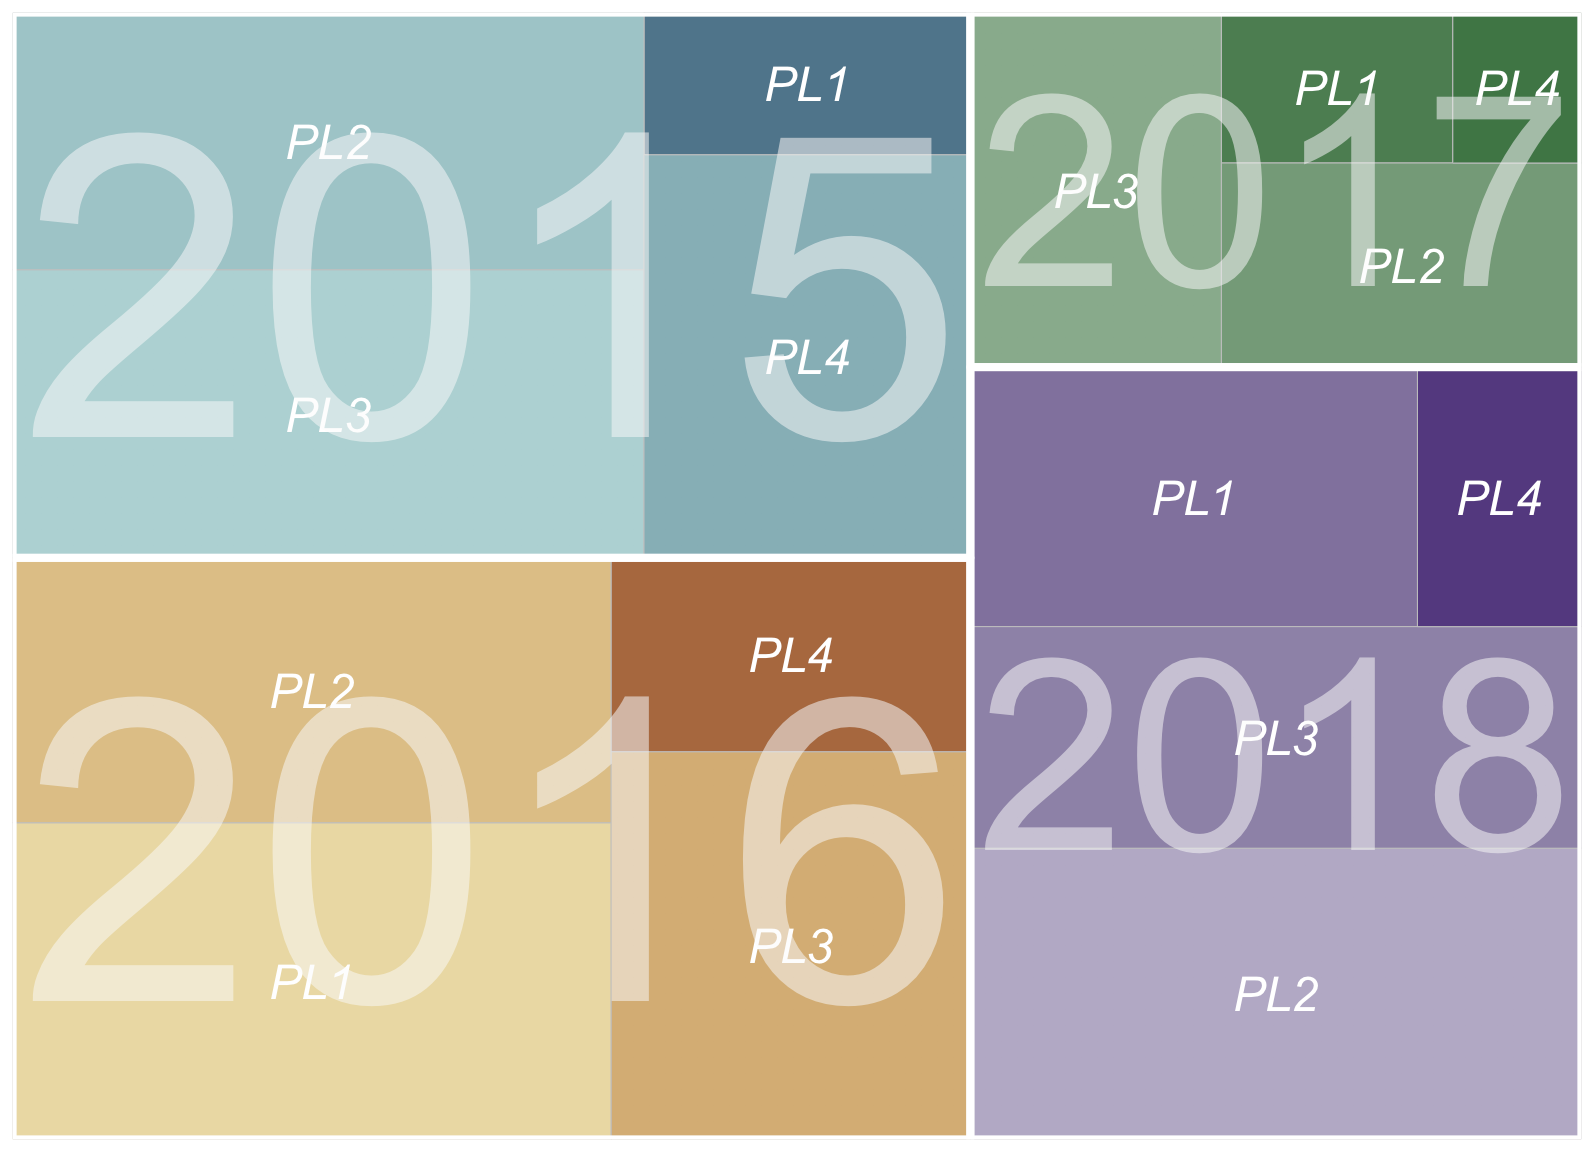
一种选择是分别计算每个单元格的颜色,然后直接绘制它们。这不能给你一个传奇,但可以说,一个传奇并不是那么有用。(你需要4个不同的传说,如果需要的话,可以将它们添加到情节中。)
library(ggplot2)
library(treemapify)

set.seed(342)
PL <- c(rep("PL1", 4), rep("PL2", 4), rep("PL3", 4), rep("PL4", 4))
CNT <- sample(seq(1:50), 16)
YEAR <- rep(c("2015", "2016", "2017", "2018"), 4)

df <- data.frame(PL, YEAR, CNT)

# code to add colors to data frame follows
# first the additional packages needed
library(dplyr)
library(colorspace)  # install via: install.packages("colorspace", repos = "http://R-Forge.R-project.org")
library(scales)

# I'll use 4 palettes from the colorspace package, one for each year
palette <- rep(c("Teal", "Red-Yellow", "Greens", "Purples"), 4)

# We add the palette names and then calculate the colors for each
# data point. Two notes:
#  - we scale the colors to the maximum CNT in each year
#  - we're calculating 6 colors but use only 5 to make the gradient;
#    this removes the lightest color
df2 <- mutate(df,
              palette = palette) %>%
  group_by(palette) %>%
  mutate(
    max_CNT = max(CNT),
    color = gradient_n_pal(sequential_hcl(6, palette = palette)[1:5])(CNT/max_CNT))


ggplot(df2, aes(area = CNT, fill = color, label=PL, subgroup=YEAR)) +
  geom_treemap() +
  geom_treemap_subgroup_border(colour="white") +
  geom_treemap_text(fontface = "italic",
                    colour = "white",
                    place = "centre",
                    grow = F,
                    reflow=T) +
  geom_treemap_subgroup_text(place = "centre",
                             grow = T,
                             alpha = 0.5,
                             colour = "#FAFAFA",
                             min.size = 0) +
  scale_fill_identity()
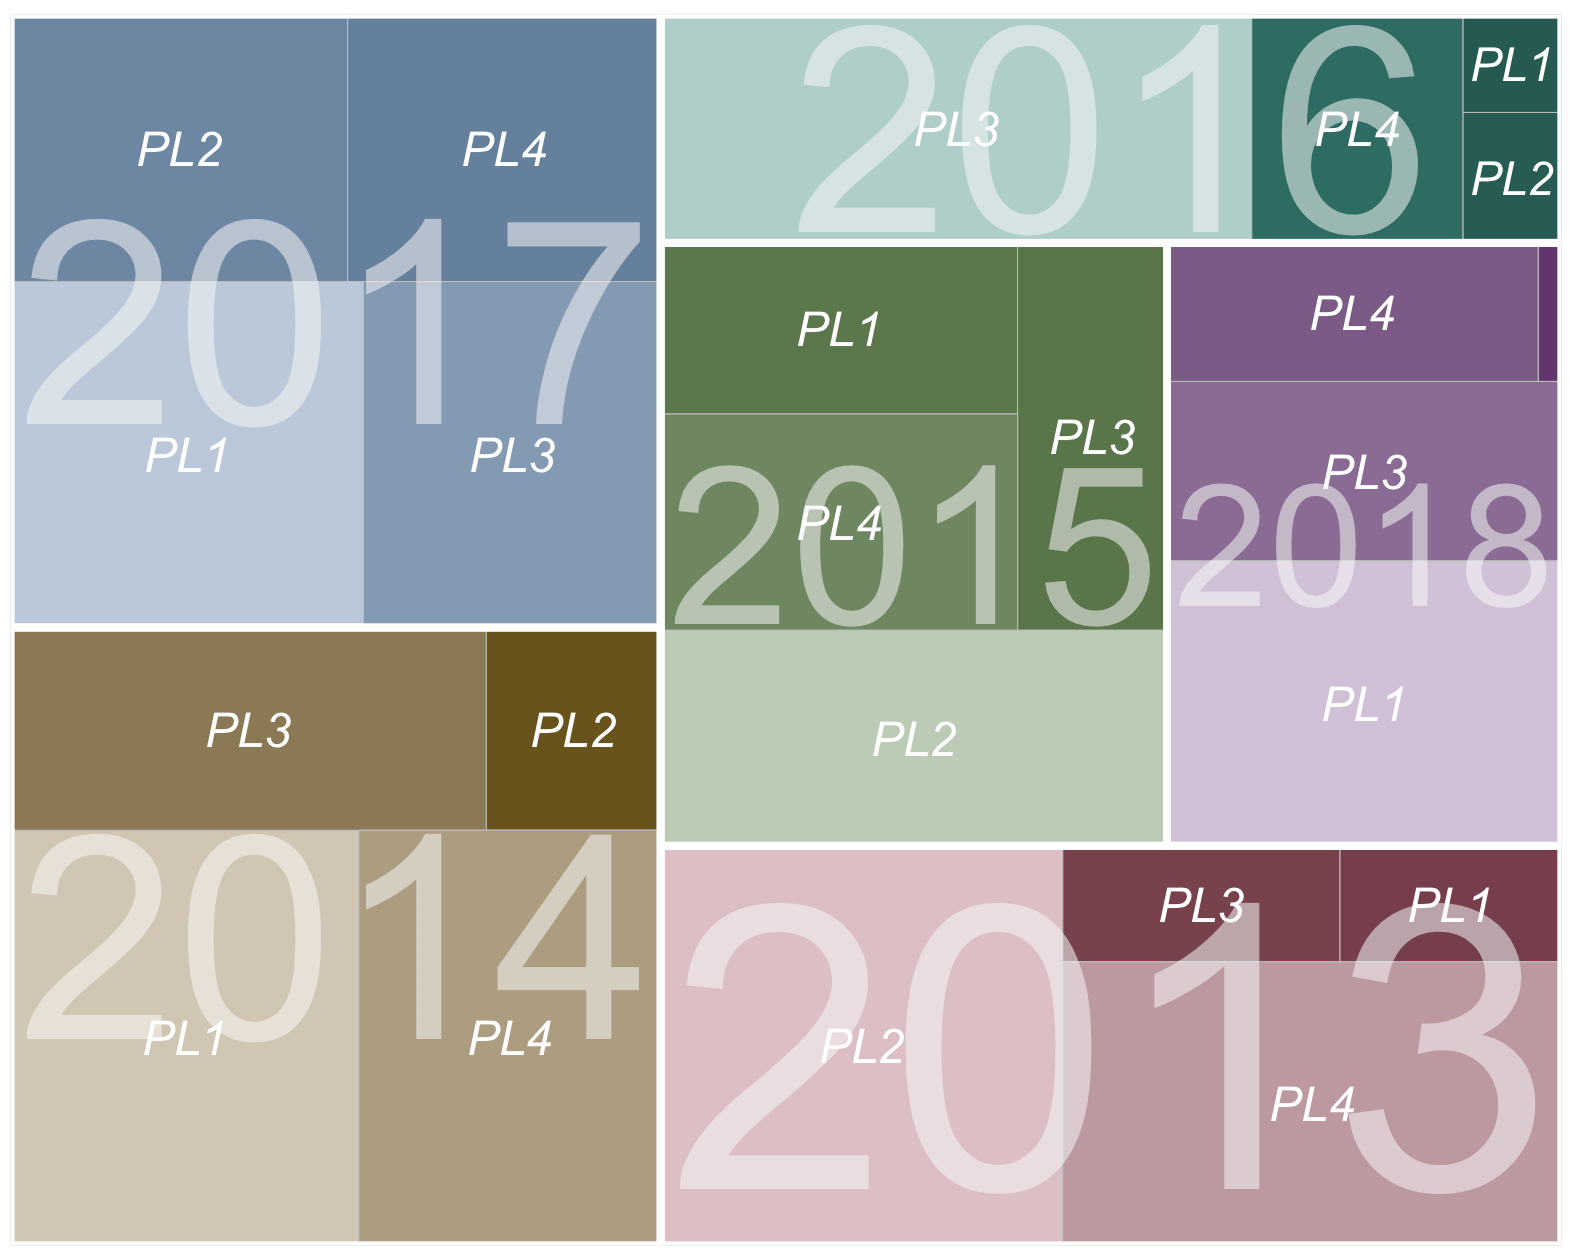
如果不提前知道会出现多少种情况,也可以动态生成色标:
library(ggplot2)
library(treemapify)

set.seed(341)
PL <- c(rep("PL1", 6), rep("PL2", 6), rep("PL3", 6), rep("PL4", 6))
CNT <- sample(seq(1:50), 24)
YEAR <- rep(c("2013", "2014", "2015", "2016", "2017", "2018"), 4)

df <- data.frame(PL, YEAR, CNT)

# code to add colors to data frame follows
# first the additional packages needed
library(dplyr)
library(colorspace)  # install via: install.packages("colorspace", repos = "http://R-Forge.R-project.org")
library(scales)

# number of palettes needed
n <- length(unique(YEAR))

# now calculate the colors for each data point
df2 <- df %>%
  mutate(index = as.numeric(factor(YEAR))- 1) %>%
  group_by(index) %>%
  mutate(
    max_CNT = max(CNT),
    color = gradient_n_pal(
      sequential_hcl(
        6,
        h = 360 * index[1]/n,
        c = c(45, 20),
        l = c(30, 80),
        power = .5)
      )(CNT/max_CNT)
    )

ggplot(df2, aes(area = CNT, fill = color, label=PL, subgroup=YEAR)) +
  geom_treemap() +
  geom_treemap_subgroup_border(colour="white") +
  geom_treemap_text(fontface = "italic",
                    colour = "white",
                    place = "centre",
                    grow = F,
                    reflow=T) +
  geom_treemap_subgroup_text(place = "centre",
                             grow = T,
                             alpha = 0.5,
                             colour = "#FAFAFA",
                             min.size = 0) +
  scale_fill_identity()
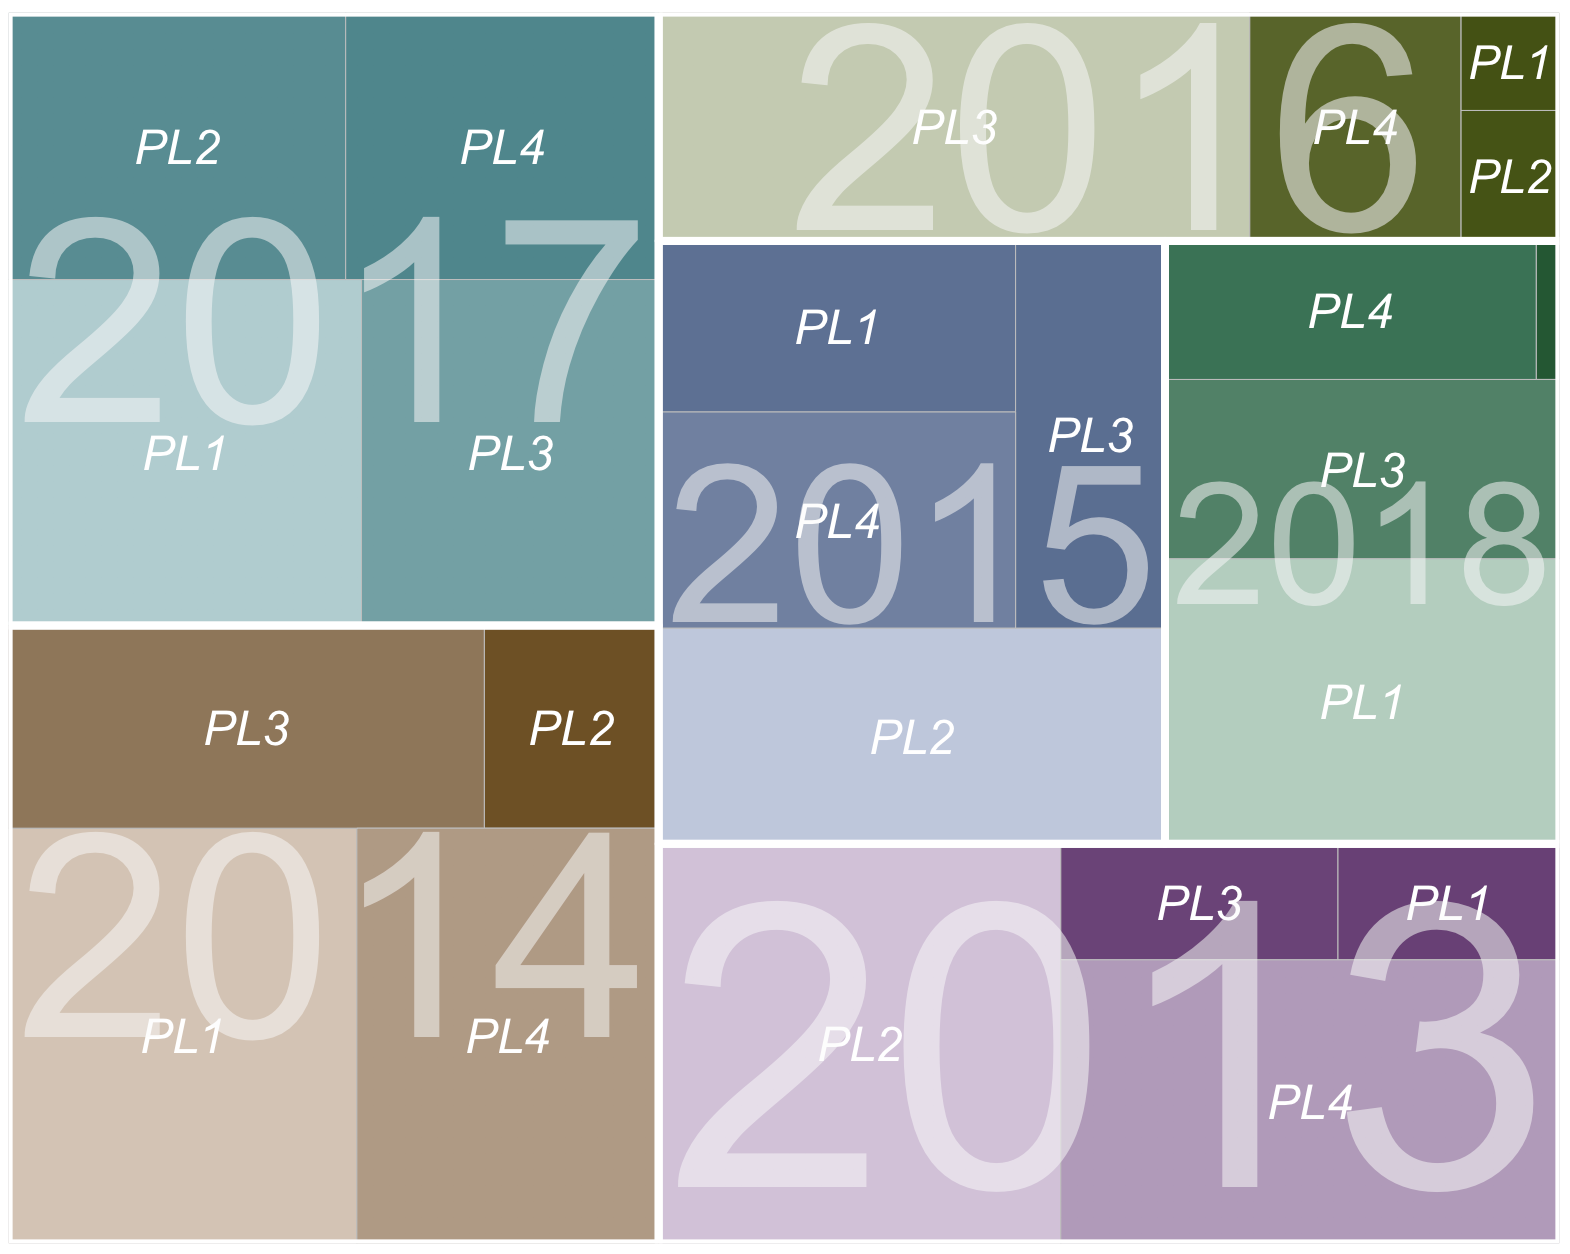
最后,您可以手动定义色标的颜色:
library(ggplot2)
library(treemapify)

set.seed(341)
PL <- c(rep("PL1", 6), rep("PL2", 6), rep("PL3", 6), rep("PL4", 6))
CNT <- sample(seq(1:50), 24)
YEAR <- rep(c("2013", "2014", "2015", "2016", "2017", "2018"), 4)

df <- data.frame(PL, YEAR, CNT)

# code to add colors to data frame follows
# first the additional packages needed
library(dplyr)
library(colorspace)  # install via: install.packages("colorspace", repos = "http://R-Forge.R-project.org")
library(scales)

# each color scale is defined by a hue, a number between 0 and 360
hues <- c(300, 50, 250, 100, 200, 150)

# now calculate the colors for each data point
df2 <- df %>%
  mutate(index = as.numeric(factor(YEAR))) %>%
  group_by(index) %>%
  mutate(
    max_CNT = max(CNT),
    color = gradient_n_pal(
      sequential_hcl(
        6,
        h = hues[index[1]],
        c = c(45, 20),
        l = c(30, 80),
        power = .5)
    )(CNT/max_CNT)
  )

ggplot(df2, aes(area = CNT, fill = color, label=PL, subgroup=YEAR)) +
  geom_treemap() +
  geom_treemap_subgroup_border(colour="white") +
  geom_treemap_text(fontface = "italic",
                    colour = "white",
                    place = "centre",
                    grow = F,
                    reflow=T) +
  geom_treemap_subgroup_text(place = "centre",
                             grow = T,
                             alpha = 0.5,
                             colour = "#FAFAFA",
                             min.size = 0) +
  scale_fill_identity()
页面原文内容由Stack Overflow提供。腾讯云小微IT领域专用引擎提供翻译支持
原文链接:
https://stackoverflow.com/questions/50163072
复制相关文章


点击加载更多
相似问题
在ns3中声明GnuplotHelper失败
Python中的Nominatim地理编码在SettingWithCopyWarning中失败
在Ns3中声明节点
PEM编码中ECC私钥的Python导入失败
ns3 buffer.h断言失败
腾讯云开发者
