
shinobi图表中的堆叠条形图和折线图
提问于 2014-01-10 06:03:38
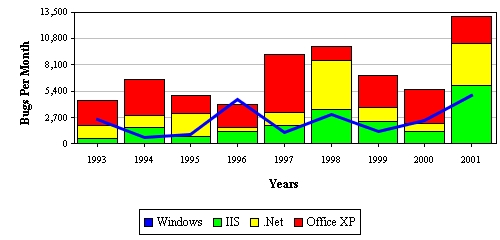
我有一个包含1个堆叠条形图和3个折线图的报告图表,该图表位于一个具有一个X和Y轴的单个图表上。我已经检查了一些shinobi图表控件,但我想不出一个方法来创建这样的图表。
我已经签出了多轴代码,但它们似乎是两个独立的图表,它们有自己的交互和手势。我希望所有这些都能同时处理。

回答 1
Stack Overflow用户
发布于 2014-01-11 21:43:20
您在那里绘制的图表不需要多轴功能。相反,您有4个不同的串联在2个堆叠组中。下面的代码示例演示了如何使用SChartDatasource方法执行此操作:
- (SChartSeries*)sChart:(ShinobiChart *)chart seriesAtIndex:(NSInteger)index {
    if(index == 3) {
        // Index 3 will be the line series
        SChartLineSeries* lineSeries = [[SChartLineSeries alloc] init];
        // Put it in the stack group indexed by the number 0
        lineSeries.stackIndex = @0;
        return lineSeries;
    } else { // index = 0, 1, 2
        // The other indices represent the columns
        SChartColumnSeries *columnSeries = [SChartColumnSeries new];
        // Put them all in the same stack group (indexed by the number 1)
        columnSeries.stackIndex = @1;
        return columnSeries;
    }
}
这将使所有系列与相同的轴相关联,因此滚动和缩放将同时影响所有系列。
页面原文内容由Stack Overflow提供。腾讯云小微IT领域专用引擎提供翻译支持
原文链接:
https://stackoverflow.com/questions/21037235
复制相关文章


![[译] 解决 iOS 15 上 APP 莫名其妙地退出登录[译] 解决 iOS 15 上 APP 莫名其妙地退出登录](https://ask.qcloudimg.com/http-save/yehe-3044776/1201034a4cf5c42a05680114007130a0.png)


腾讯云开发者
