未显示的WPF工具包饼图
未显示的WPF工具包饼图
提问于 2017-04-01 10:48:37
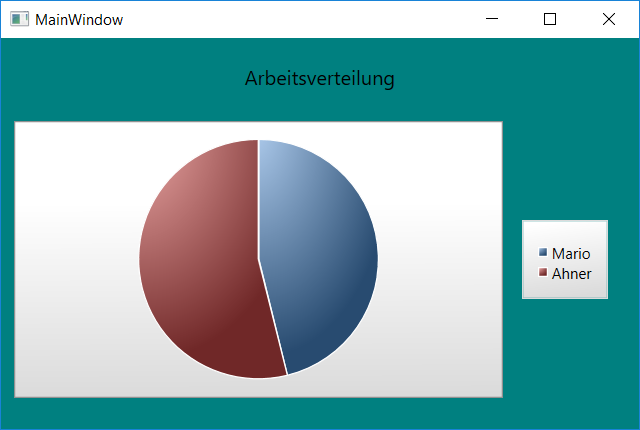
我试图使用WPF工具包(System.Windows.Controls.DataVisualization.Toolkit.dll)在WPF中显示饼图。
图表本身是通过在我的XAML中执行以下操作来创建的:
<DVC:Chart BorderThickness="0" Title="Arbeitsverteilung" Grid.Column="0" Grid.Row="0" Background="Teal" x:Name="workDist" >
  <DVC:Chart.Series>
    <DVC:PieSeries
      IndependentValuePath="Key"
      DependentValuePath="Value"
      VerticalAlignment="Top"
      HorizontalAlignment="Stretch"/>
  </DVC:Chart.Series>
</DVC:Chart>
并使用以下方法设置DataSource:
private void LoadData()
{
  ((PieSeries)workDist.Series[0]).ItemsSource =
    new KeyValuePair<string, int>[] {
      new KeyValuePair<string, int> ("Mario", 12),
      new KeyValuePair<string, int> ("Ahner", 14)};
}
这似乎可以很好地解决一个问题:它只显示图表的图例,而不显示图表本身:

我已经读过一些教程了,但是每个人都和我完全一样,而且效果很好。
如果有人能帮我就好了!
回答 1
Stack Overflow用户
回答已采纳
发布于 2017-04-01 14:39:34
取出顶部垂直排列:
    <DVC:Chart BorderThickness="0" Title="Arbeitsverteilung" Grid.Column="0" Grid.Row="0" Background="Teal" x:Name="workDist" >
        <DVC:Chart.Series>
            <DVC:PieSeries
                IndependentValuePath="Key"
                DependentValuePath="Value"
                HorizontalAlignment="Stretch"
                />
        </DVC:Chart.Series>
    </DVC:Chart>
页面原文内容由Stack Overflow提供。腾讯云小微IT领域专用引擎提供翻译支持
原文链接:
https://stackoverflow.com/questions/43160702
复制


![echarts饼图显示百分比[echarts字体模糊]](https://ask.qcloudimg.com/http-save/yehe-1011815/ad49cdfff9e7776bc1a563f6ea45e832.jpeg)


相似问题
饼图未显示WPF
用未显示点的WPF工具包绑定饼图
WPF工具包饼图填充值
WPF饼图-图表上未显示的切片
饼图未显示切片
添加站长 进交流群
领取专属 10元无门槛券
AI混元助手 在线答疑

关注 腾讯云开发者公众号
洞察 腾讯核心技术
剖析业界实践案例

腾讯云开发者
