使用底图在地图上放置饼图
使用底图在地图上放置饼图
提问于 2014-06-19 13:15:36
我想使用底图和Matplotlib在地图上绘制饼图。
你知道做这件事的方法吗?
回答 1
Stack Overflow用户
发布于 2014-06-19 20:44:24
可以使用inset_axes将轴添加到底图。我已经修改了第一个示例here,使其包含一个饼图。
from mpl_toolkits.basemap import Basemap
from mpl_toolkits.axes_grid1.inset_locator import inset_axes
import matplotlib.pyplot as plt

# setup Lambert Conformal basemap.
fig = plt.figure()
ax = fig.add_subplot(111)
m = Basemap(width=12000000,height=9000000,projection='lcc',
            resolution='c',lat_1=45.,lat_2=55,lat_0=50,lon_0=-107.,ax=ax)
# draw coastlines.
m.drawcoastlines()
# draw a boundary around the map, fill the background.
# this background will end up being the ocean color, since
# the continents will be drawn on top.
m.drawmapboundary(fill_color='aqua')
# fill continents, set lake color same as ocean color.
m.fillcontinents(color='coral',lake_color='aqua')

axin = inset_axes(m.ax,width="30%",height="30%", loc=3)
axin.pie([100,200,3000])
plt.show()

页面原文内容由Stack Overflow提供。腾讯云小微IT领域专用引擎提供翻译支持
原文链接:
https://stackoverflow.com/questions/24307549
复制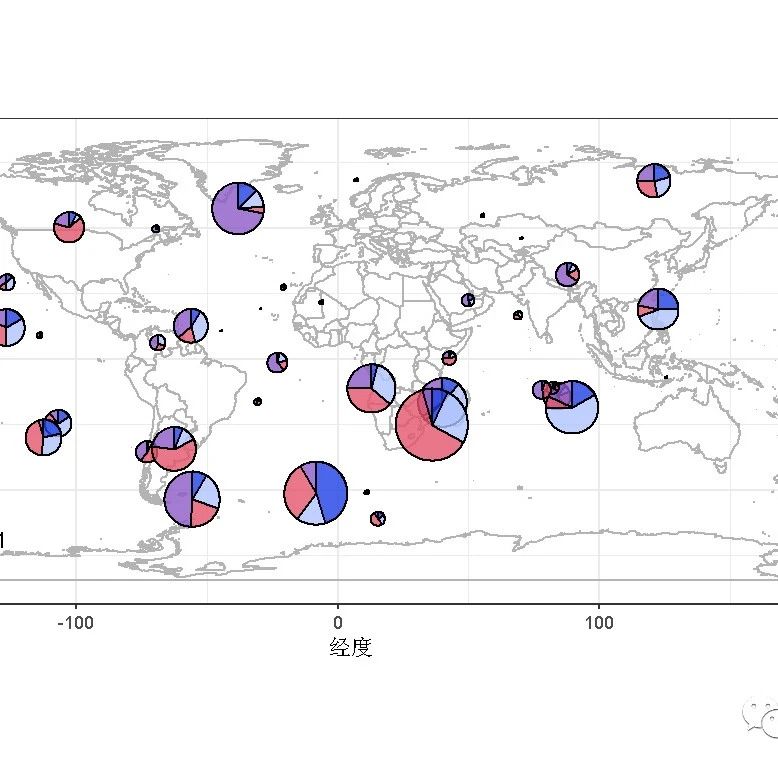


相似问题
如何在SVG地图上放置饼图?
在饼图上放置标签
底图上的热图\RuntimeError matplotlib-底图
如何使用matplotlib底图在底图上绘制数据
散点图上的饼图
添加站长 进交流群
领取专属 10元无门槛券
AI混元助手 在线答疑

关注 腾讯云开发者公众号
洞察 腾讯核心技术
剖析业界实践案例

腾讯云开发者
