dc.js不显示y轴
dc.js不显示y轴
提问于 2019-02-26 06:17:09
我有一组数据,我想在折线图上呈现该频率
数据解析
var volumeChart = dc.barChart('#monthly-volume-chart');
var dateFormatSpecifier = '%Y-%m-%dT%H:%M:%S.000Z';
    var dateFormat = d3.timeFormat(dateFormatSpecifier);
    var dateFormatParser = d3.timeParse(dateFormatSpecifier);
    var numberFormat = d3.format('.2f');

    data.forEach(function (d) {
        d.dd = dateFormatParser(d.timestamp);
        d.minute = d3.timeMinute(d.dd)
        //coerce to number with a +
    });
维度分组
var freqByMins = ndx.dimension(function (d) {
    return d.minute;
});
var aa = freqByMins.group()
console.log(aa.all())
var freqByMinsGroup = aa.reduceCount(function (d) {
    return d.minute;
});
console.log(freqByMinsGroup.all())查看freqByMinsGroup.all(),我得到了以下数据
0: {key: Thu Feb 21 2019 05:29:00 GMT+0800 (Singapore Standard Time), value: 2}
1: {key: Thu Feb 21 2019 05:30:00 GMT+0800 (Singapore Standard Time), value: 5}
2: {key: Thu Feb 21 2019 05:31:00 GMT+0800 (Singapore Standard Time), value: 6}
3: {key: Thu Feb 21 2019 05:32:00 GMT+0800 (Singapore Standard Time), value: 3}
4: {key: Thu Feb 21 2019 05:33:00 GMT+0800 (Singapore Standard Time), value: 1}
5: {key: Thu Feb 21 2019 05:34:00 GMT+0800 (Singapore Standard Time), value: 1}
6: {key: Thu Feb 21 2019 05:35:00 GMT+0800 (Singapore Standard Time), value: 3}
7: {key: Thu Feb 21 2019 05:36:00 GMT+0800 (Singapore Standard Time), value: 4}
8: {key: Thu Feb 21 2019 05:38:00 GMT+0800 (Singapore Standard Time), value: 4}
9: {key: Thu Feb 21 2019 05:39:00 GMT+0800 (Singapore Standard Time), value: 7}
length: 10
呈现图表
volumeChart.width(960)
.height(100)
.margins({top: 10, right: 10, bottom: 20, left: 40})
.dimension(freqByMins)
.group(freqByMinsGroup)
.transitionDuration(500)
.elasticY(true)
.x(d3.scaleTime().domain([new Date(2019, 2, 21, 5, 29, 0), new Date(2019, 2, 21, 5, 40, 0)]))
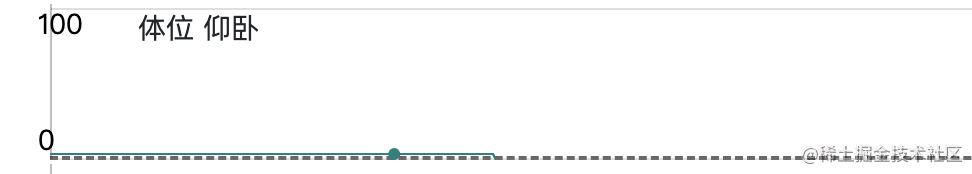
.xAxis();但是,我的交叉过滤器图表没有呈现任何y轴。
附件是一张图片

回答 1
Stack Overflow用户
发布于 2019-02-27 05:28:19
对于任何可能正在关注这个问题的人来说,
错误出现在html中。
<div class="row">
    <div id="monthly-move-chart">
        <strong>Monthly Index Abs Move & Volume/500,000 Chart</strong>
        <span class="reset" style="display: none;">range: <span class="filter"></span></span>
        <a class="reset" href="javascript:moveChart.filterAll();volumeChart.filterAll();dc.redrawAll();"
           style="display: none;">reset</a>

        <div class="clearfix"></div>
    </div>
</div>
当我使用另一个索引时
<div id="quarter-chart">
        <strong>Quarters</strong>
        <a class="reset" href="javascript:quarterChart.filterAll();dc.redrawAll();" style="display: none;">reset</a>

        <div class="clearfix"></div>
</div>啊,真灵。我猜这是因为它依赖于另一个图表。我实际上是在修改来自https://dc-js.github.io/dc.datatables.js/的示例,当我没有真正检查html时,这可能会导致一些有趣的错误
页面原文内容由Stack Overflow提供。腾讯云小微IT领域专用引擎提供翻译支持
原文链接:
https://stackoverflow.com/questions/54879469
复制


相似问题
如何更改Y轴dc.js
dc.js图形不会显示线条和y轴值
dc.js x轴不刷新
dc.js:如何在单线图的两边显示y轴?
dc.js按y轴/值排序序数线图
添加站长 进交流群
领取专属 10元无门槛券
AI混元助手 在线答疑

关注 腾讯云开发者公众号
洞察 腾讯核心技术
剖析业界实践案例

腾讯云开发者
