如何在ggplot2上利用标识控制叠加条形图的有序性
如何在ggplot2上利用标识控制叠加条形图的有序性
提问于 2015-09-01 22:22:20
使用这个虚拟的data.frame
ts <- data.frame(x=1:3, y=c("blue", "white", "white"), z=c("one", "one", "two"))我试着在上面画“蓝色”类。
ggplot(ts, aes(z, x, fill=factor(y, levels=c("blue","white" )))) + geom_bar(stat = "identity")
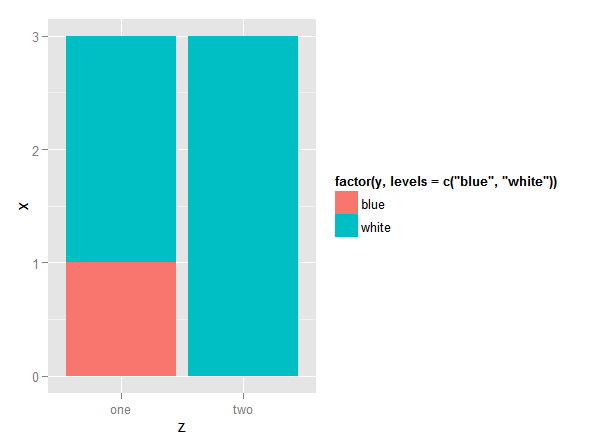
上面写着“白色”。和
ggplot(ts, aes(z, x, fill=factor(y, levels=c("white", "blue")))) + geom_bar(stat = "identity")
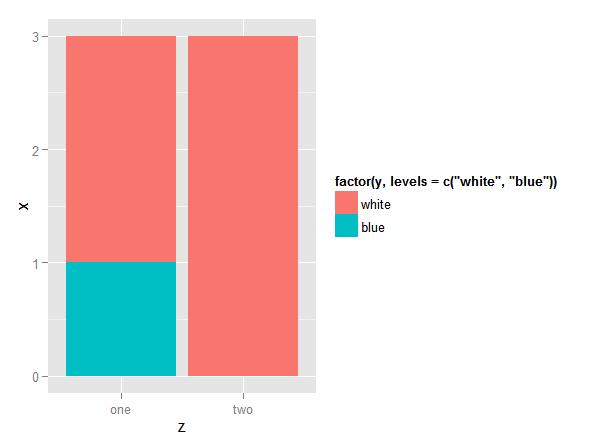
颠倒颜色,但仍然给我“白色”的顶部。我怎么才能把“蓝色”放在上面?
回答 6
Stack Overflow用户
回答已采纳
发布于 2015-09-01 23:10:38
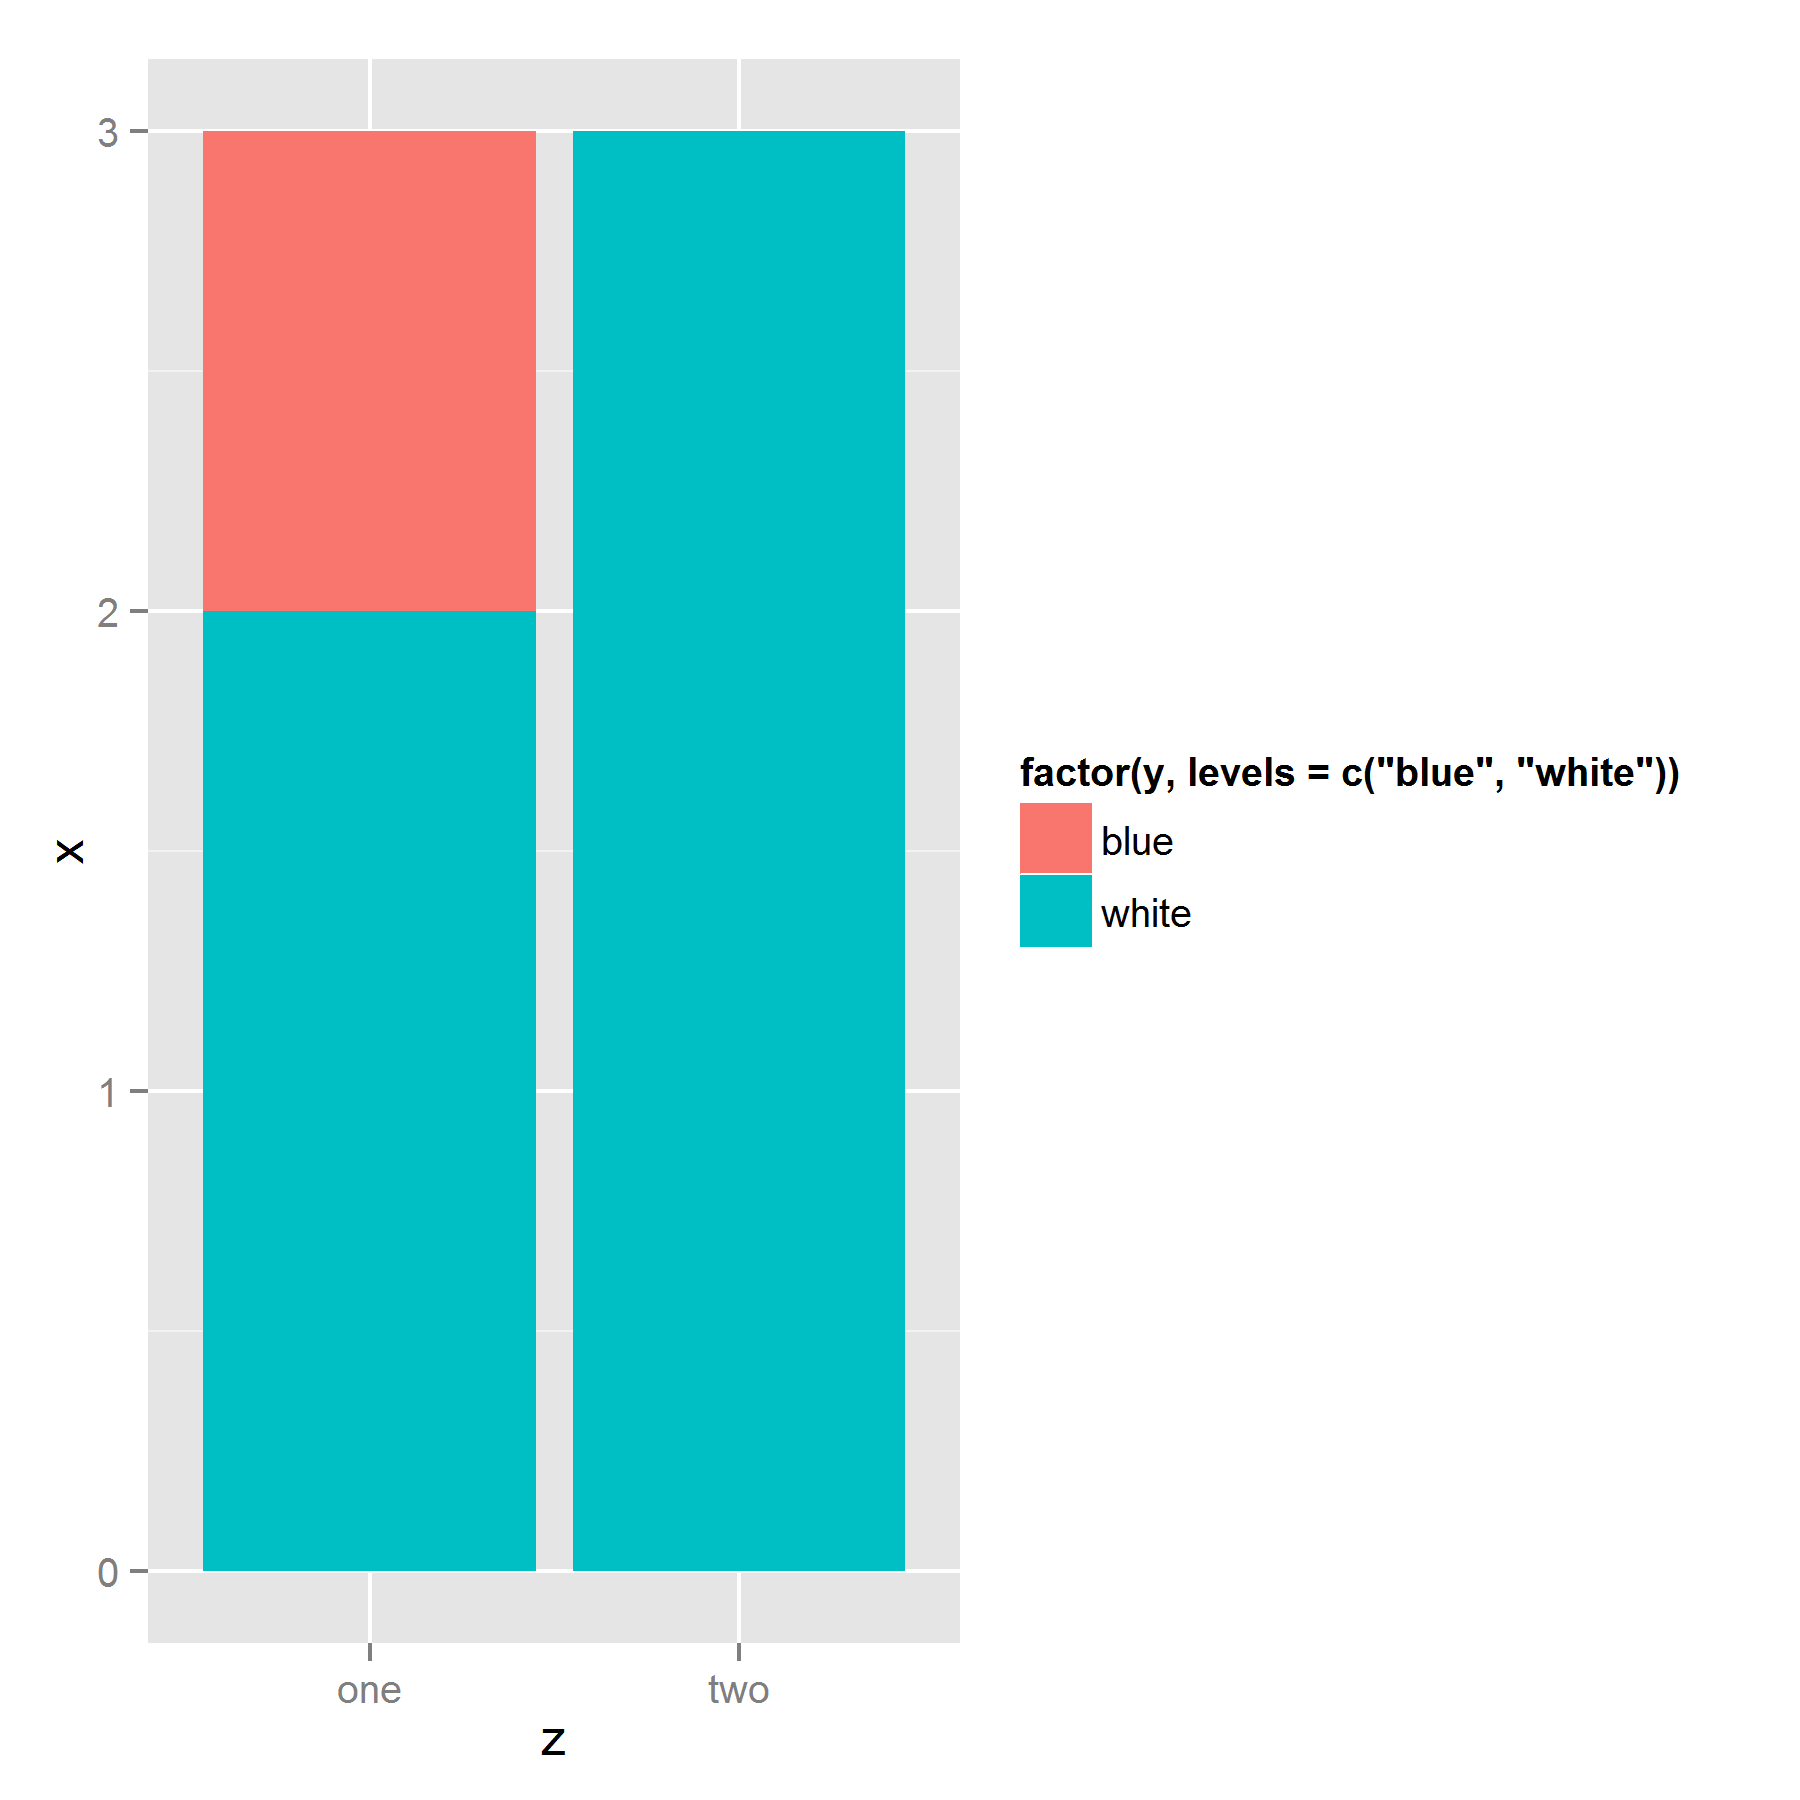
我以前也曾为同样的问题而奋斗过。它似乎是基于数据栏中的外观来堆叠条形的。因此,解决问题的方法是按照填充因子按相反的顺序对数据进行排序,希望它出现在图例中:数据帧顶部的底部项和底部的顶部项:
ggplot(ts[order(ts$y, decreasing = T),],
       aes(z, x, fill=factor(y, levels=c("blue","white" )))) +
  geom_bar(stat = "identity")
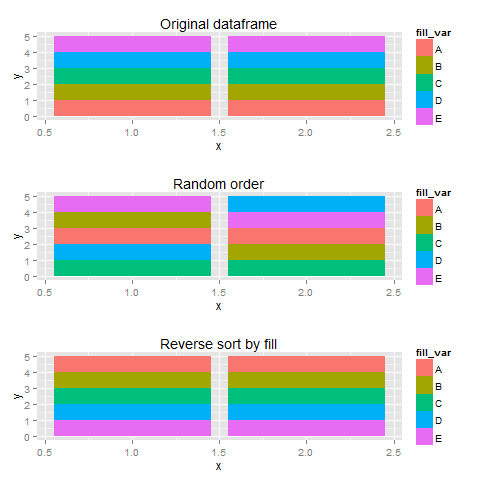
编辑:更多插图
使用样本数据,我创建了三幅具有不同顺序的数据图,我认为更多的填充变量会使事情变得更加清晰。
set.seed(123)
library(gridExtra)
df <- data.frame(x=rep(c(1,2),each=5),
                 fill_var=rep(LETTERS[1:5], 2),
                 y=1)
#original order
p1 <- ggplot(df, aes(x=x,y=y,fill=fill_var))+
  geom_bar(stat="identity") + labs(title="Original dataframe")


#random order
p2 <- ggplot(df[sample(1:10),],aes(x=x,y=y,fill=fill_var))+
  geom_bar(stat="identity") + labs(title="Random order")
#legend checks out, sequence wird

#reverse order
p3 <- ggplot(df[order(df$fill_var,decreasing=T),],
             aes(x=x,y=y,fill=fill_var))+
  geom_bar(stat="identity") + labs(title="Reverse sort by fill")

plots <- list(p1,p2,p3)

do.call(grid.arrange,plots)
Stack Overflow用户
发布于 2017-05-10 07:16:08
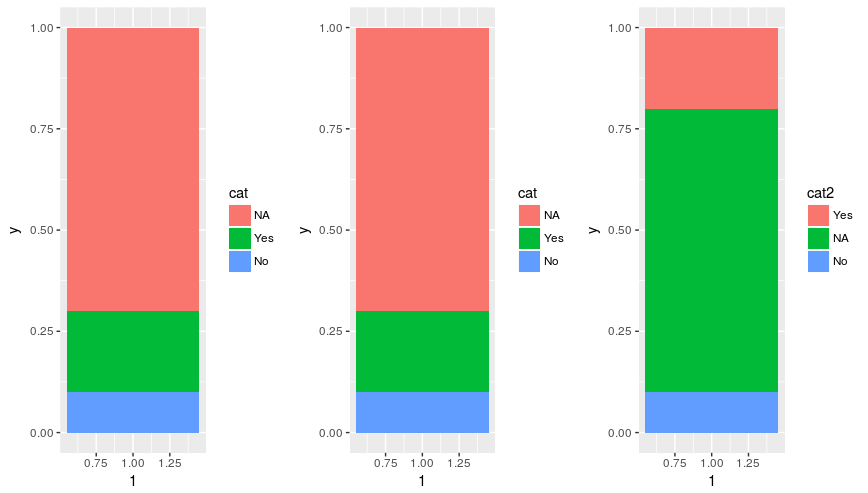
就其价值而言,在ggplot2版本2.2.1中,堆栈的顺序不再由data.frame中的行顺序决定。相反,它与图例的顺序相匹配,这是由因子中的级别顺序决定的。
d <- data.frame(
  y=c(0.1, 0.2, 0.7),
  cat = factor(c('No', 'Yes', 'NA'), levels = c('NA', 'Yes', 'No')))

# Original order
p1 <- ggplot(d, aes(x=1, y=y, fill=cat)) +
  geom_bar(stat='identity')

# Change order of rows
p2 <- ggplot(d[c(2, 3, 1), ], aes(x=1, y=y, fill=cat)) +
  geom_bar(stat='identity')

# Change order of levels
d$cat2 <- relevel(d$cat, 'Yes')
p3 <- ggplot(d, aes(x=1, y=y, fill=cat2)) +
  geom_bar(stat='identity')

grid.arrange(p1, p2, p3, ncol=3)
其结果如下:
Stack Overflow用户
发布于 2017-05-19 09:32:52
在group调用中使用ggplot()智能。这确保了所有层都以相同的方式堆叠。
series <- data.frame(
  time = c(rep(1, 4),rep(2, 4), rep(3, 4), rep(4, 4)),
  type = rep(c('a', 'b', 'c', 'd'), 4),
  value = rpois(16, 10)
)

ggplot(series, aes(time, value, group = type)) +
  geom_col(aes(fill = type)) +
geom_text(aes(label = type), position = "stack")页面原文内容由Stack Overflow提供。腾讯云小微IT领域专用引擎提供翻译支持
原文链接:
https://stackoverflow.com/questions/32345923
复制相关文章


![[会员专享] ggplot2绘制环状正负堆砌条形图](https://ask.qcloudimg.com/http-save/yehe-9957031/c5e26be1d0bf4f86536ec260814b04a1.png)


相似问题
利用R中的ggplot2实现叠加条形图上的叠加线
利用ggplot2实现中心叠加条形图的定位值
如何在ggplot2中叠加条形图
利用ggplot2每天叠加直方图
如何利用R控制水平叠加条形图的取值范围
添加站长 进交流群
领取专属 10元无门槛券
AI混元助手 在线答疑

关注 腾讯云开发者公众号
洞察 腾讯核心技术
剖析业界实践案例

腾讯云开发者
