
如何在x轴上对齐直方图的柱状图或使其对中?
提问于 2017-05-28 08:35:48
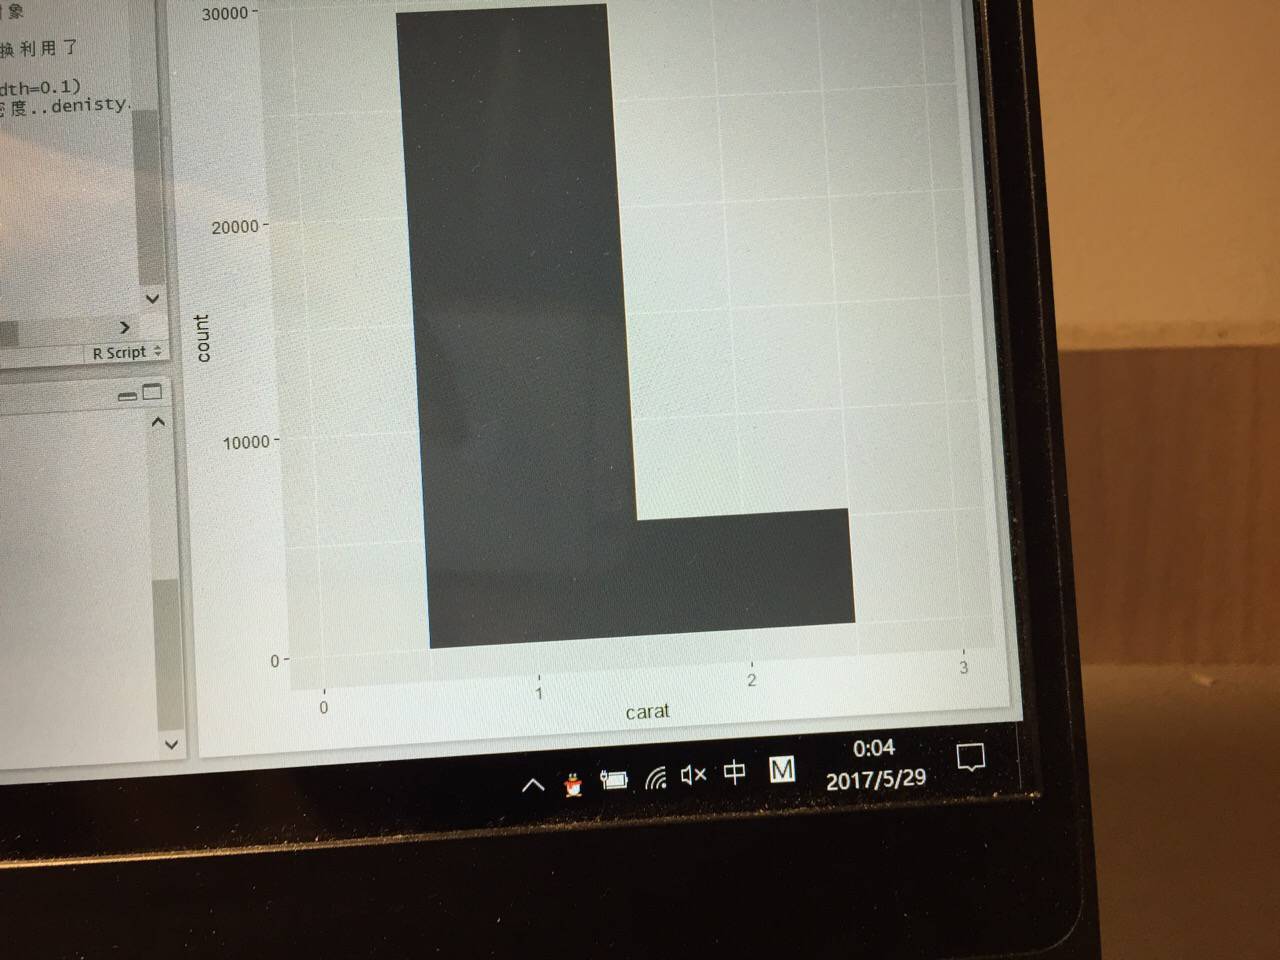
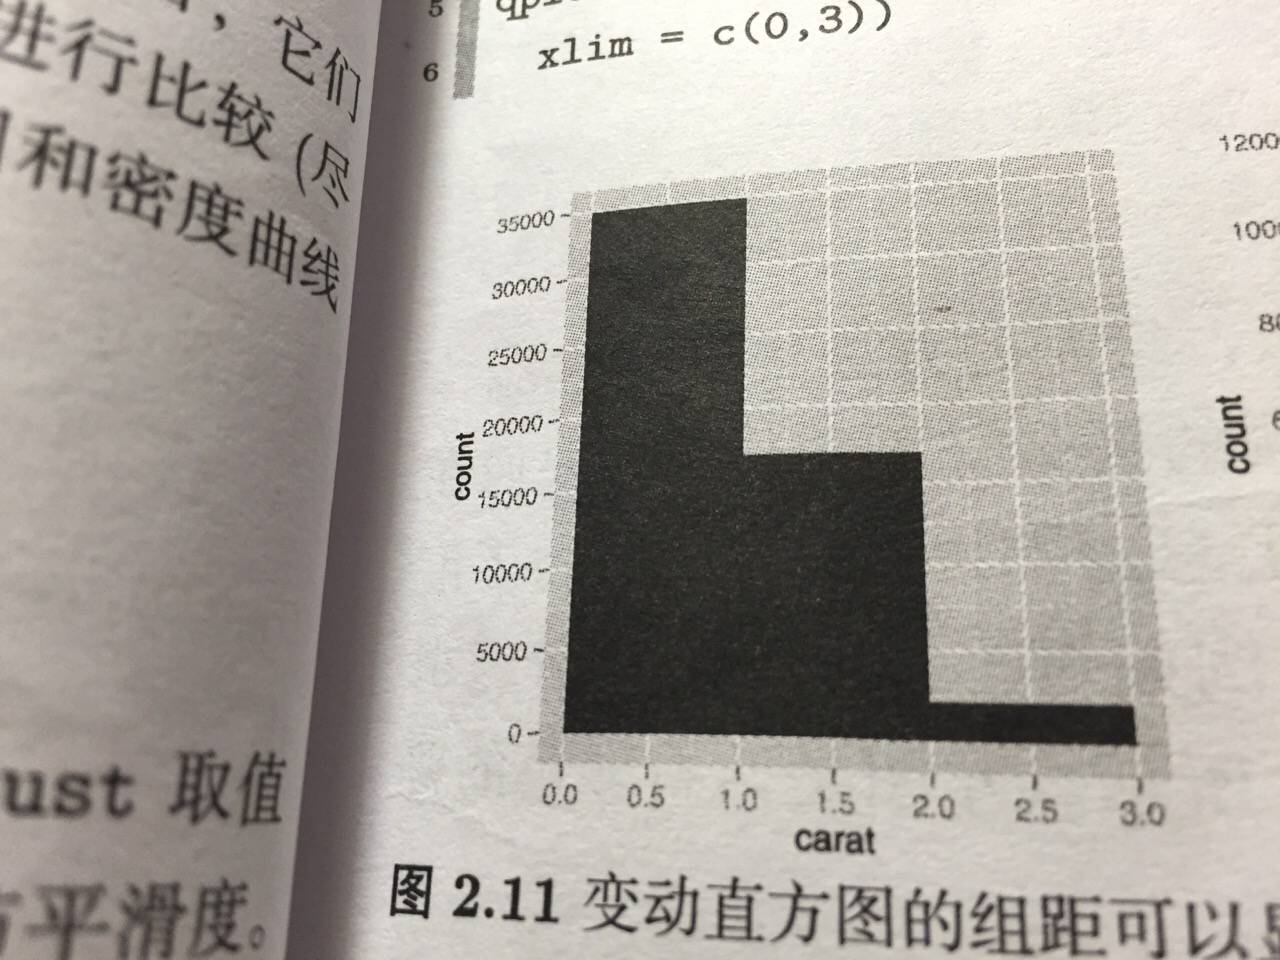
qplot(carat,data=diamonds,geom="histogram",binwidth=1,xlim=c(0,3))我用这段代码绘制直方图。但结果与书本不同。

回答 1
Stack Overflow用户
回答已采纳
发布于 2017-05-28 22:36:28
有两种可能性,要么使用center参数作为suggested by Richard Telford,要么使用boundary参数。
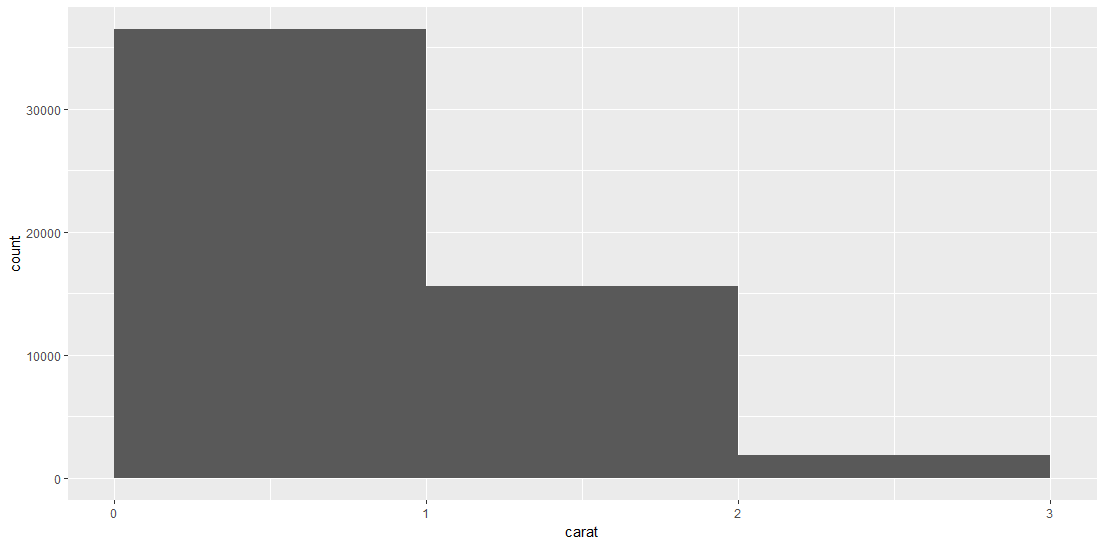
下面这两个代码将创建相同的图表:
library(ggplot2)  # CRAN version 2.2.1 used
qplot(carat, data=diamonds, geom = "histogram", binwidth = 1, xlim = c(0,3),
      center = 0.5)
qplot(carat, data=diamonds, geom = "histogram", binwidth = 1, xlim = c(0,3),
      boundary = 0)
有关更多细节,请参见?geom_histogram。
页面原文内容由Stack Overflow提供。腾讯云小微IT领域专用引擎提供翻译支持
原文链接:
https://stackoverflow.com/questions/44229652
复制


腾讯云开发者
